
My coverage and comparing tests
See how your station grows test after test: globe, records, best hours, growth by antenna, the list of tests, and two tests compared side by side.
Free and ProUpdated for HamQSO 0.1.19
On this page
My coverage gathers every coverage test you have saved and tells its story: where you were heard, your records, the hours when they hear you most and how your station grows when you change antenna. From here you reopen any test and compare two of them side by side.
Opening My coverage
Start from the Coverage test page (see Running a coverage test) and take one of these ways:
- Tap My coverage, the button below your tests and records (it is there once you have saved a test). The Overview tab opens.
- Tap See all N tests below "Your tests" (from two saved tests), or the Your tests icon at the top right (phone and tablet, also without tests). On the web, in a wide window, press H. The All tests tab opens directly.
The card under The last test and the records on that page also open their saved test.
Right after you save a test, the "Test saved" bar at the bottom has See: it opens that test.
The page has two tabs: Overview and All tests; next to All tests is the number of saved tests.
The Overview
The Overview has four sections. Each one is drawn once you have enough tests; before that you see it as a preview (empty or blurred), with a label saying how many tests it needs ("Needs 1 test" or "Needs 5 tests, you have 2").
| Section | What it shows | From how many tests |
|---|---|---|
| All your tests | The globe with every skimmer that heard you | 1 |
| Records | Your four personal records | 1 |
| When they hear you most | The best UTC hours, band by band | 5 |
| How your station grows | The margin over the forecast of every test over time, by antenna | 3 |
Every saved test counts, also those on bands the forecast does not cover.
Without any test, the top of the page shows the "Your coverage grows here" box with Run the test. While you have fewer than three tests, the Saved tests section at the bottom lists them, again with Run the test; from the third test it is replaced by See all N tests, which opens the All tests tab.
All your tests
A globe with an arc to every skimmer that heard you at least once: the more often it heard you, the thicker the arc. At the top left you read how many tests, skimmers and continents there are.
- Tap Replay: the globe grows from the first test to today in a few seconds. Tap Stop to stop it.
- Drag the slider below the globe to see your coverage up to a given date, written on the right.
- With the buttons at the top right you open the globe in Full screen or tap Show all skimmers.
Replay and the slider work from two tests up. If you have reduced animations on your device, Replay shows the whole globe at once.
Records
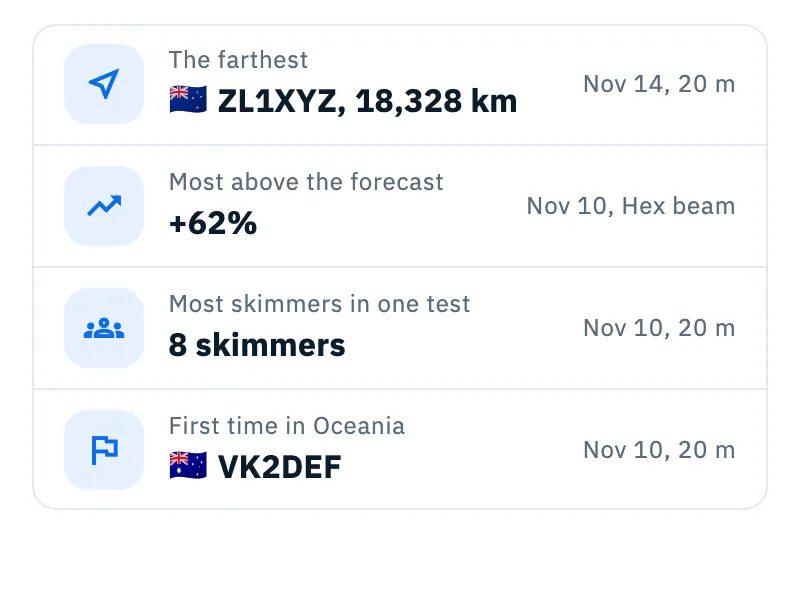
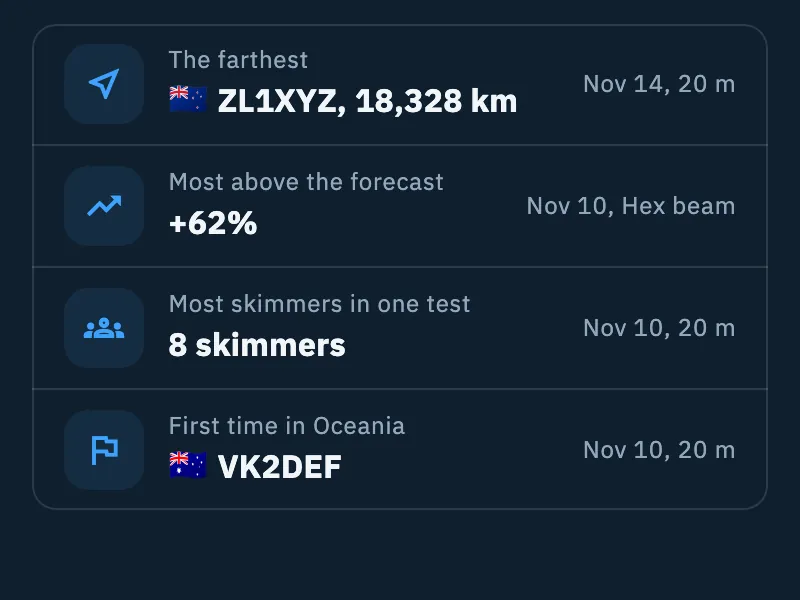
Four records, each with the date and the band (or the antenna) of the test that set it. Tap a record to open that test.
- The farthest: the farthest skimmer that ever heard you, with the distance.
- Most above the forecast: the test with the highest margin. Only tests with a forecast count.
- Most skimmers in one test: the test heard by the most skimmers.
- First time in …: the last continent you reached for the first time, with the skimmer that heard you.
When they hear you most
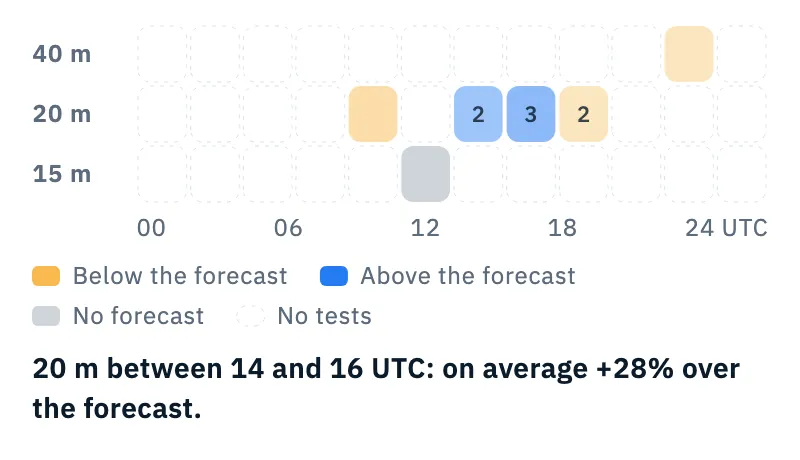
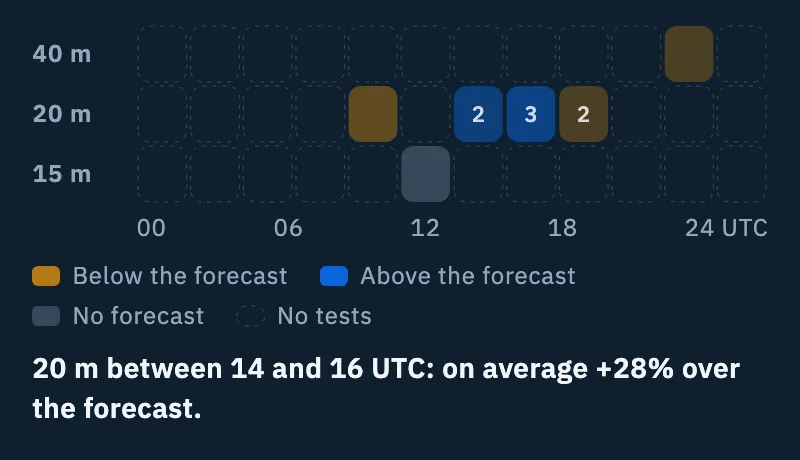
A grid with a row per band and a cell every 2 UTC hours. The number in a cell says how many tests there are (shown from 2 up); the colour is the average margin over the forecast:
- blue, Above the forecast: the stronger, the further above;
- amber, Below the forecast;
- grey, No forecast: tests on a band the forecast does not cover (they count, but give no colour);
- dashed outline, No tests.
Below the key a sentence points to the best slot, for example "20 m between 14 and 16 UTC: on average +55% over the forecast.". It appears once a slot has at least two tests with a forecast. Long-press (or hover over) a cell to read band, hours, number of tests and margin.
It helps you choose the time and the band to operate.
How your station grows
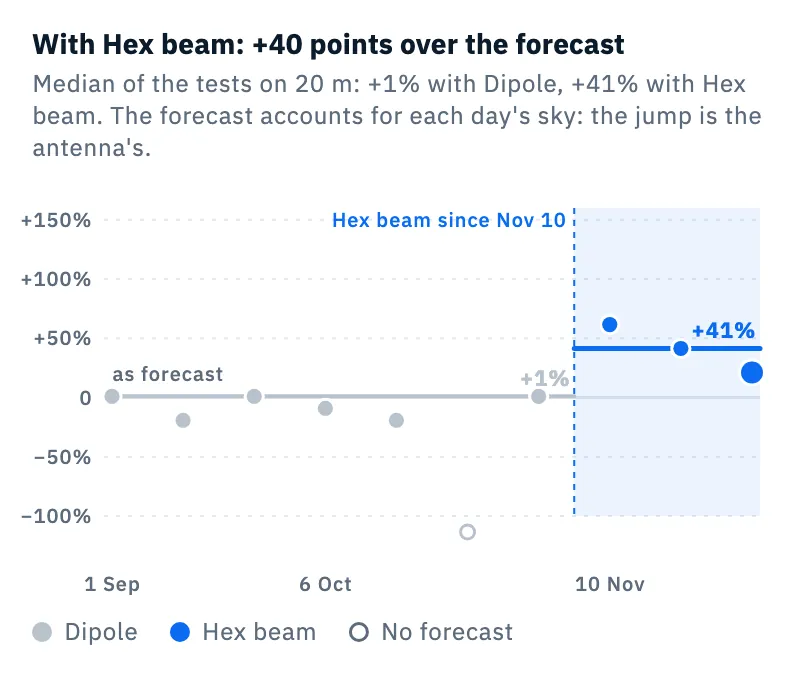
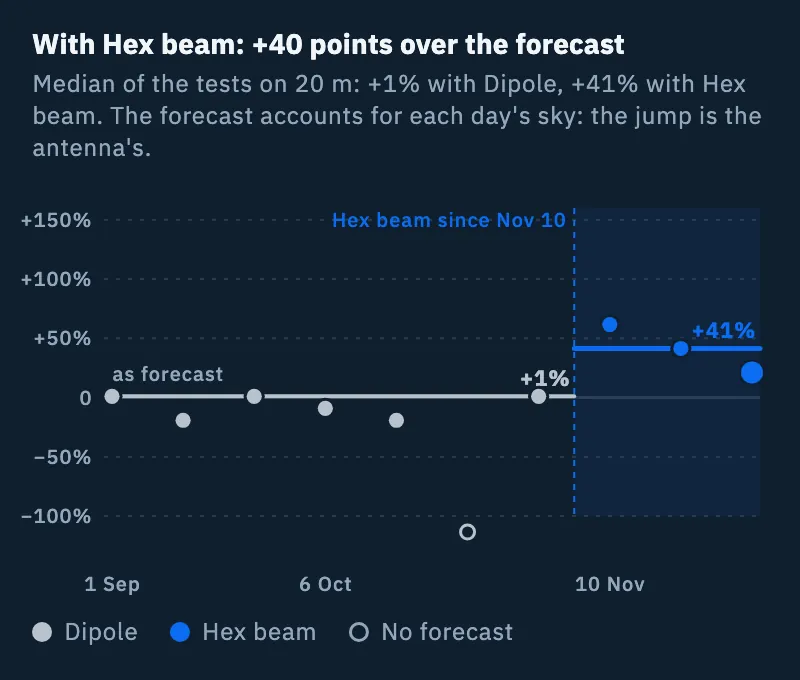
A chart with a dot for every test, from oldest to newest, and a colour per antenna. The "as forecast" line is zero: above it you did better than the forecast, below it worse. Tests without a forecast are hollow dots on a row at the bottom (No forecast); tests without an antenna are No antenna.
When the antenna of the last test with a forecast and another antenna have at least two tests with a forecast each, on the same band and with the same radio, the top line tells you the jump, for example "With Hex beam: +61 points over the forecast", and the two medians below it. The chart highlights the period of the new antenna ("Hex beam since …") and draws the median of each antenna. The forecast accounts for each day's sky, so the jump is the antenna's.
All tests
The All tests tab is the list of your saved tests.
- Type in the Search tests field: the search looks only at the names of the tests.
- Narrow it with the Band, Radio and Antenna filters: each menu has All and the entries of your tests, with how many tests each. Show all turns the filters off (the search stays).
- Choose the Order: By date (newest first, grouped by month, for example "November 2026, 3 tests") or By margin ("Most above the forecast first", tests without a forecast last).
- Tap a test to open it.
Next to the order you read how many tests you see ("7 of 10" when a filter or the search hides some). Each row has a small rose of the directions you were heard in, the name, band and date; on the right the margin over the forecast (green above, red below, "–" without a forecast) and the farthest skimmer. The row's ⋮ menu has Rename and Delete.
A saved test
On a phone the test opens on the Saved test page; on a tablet and on the web on the right of the list ("The test you choose opens here."). At the top you find the name, radio, antenna, power, locator, band and date with the UTC time; below it, the whole result of the test as right after you ran it (see Reading the test result).
- Rename: the name becomes a field, already selected. Type up to 40 characters (the counter shows in the last 10) and tap Save or press Enter; Cancel or Esc leave the name as it was. An empty field goes back to the name the app proposed, as the help below the field says. The "Name changed" bar has Undo.
- Compare with…: this test is already chosen, you choose the second (see below).
- Share: opens sharing for the test (see Saving and sharing a test).
- Delete (only the bin icon on a phone): the test goes away at once, without a question; the "Test deleted" bar has Undo to bring it back.
The name of a test is private: it never goes on the image or on the public page.
If the forecast of a test had not arrived yet when you saved it, the app asks for it again when you open My coverage or that test.
Comparing two tests
The comparison tells you whether a change to your station really pays off. You can start it from three places:
- in the All tests tab, Compare (shown when the list has at least two tests);
- in a saved test, Compare with…;
- on the Coverage test page, Compare next to My coverage (with at least two tests): the last test is already chosen.
Then:
- Tap the tests to compare. The bar at the bottom says "Choose two tests to compare", then "Choose the second test", then "The older is A, the newer is B". On a phone the title counts the tests chosen, for example "1 of 2".
- A third test replaces the first one you chose; a tap on a chosen test removes it. Cancel leaves the choice.
- Tap Compare. Compare the tests opens.
At the top you see the cards of A and B: name, band, date and UTC time, how many skimmers heard you. The globe shows the arcs of A in orange and of B in blue, with the big number at the bottom, for example "+61 points over the forecast with Hex beam" ("… with B" on different bands), and a summary line ("A +1%, B +82%.", "+4 skimmers.", "The farthest at … against …"). With A and B, Only A and Only B you choose which arcs to see.
Below there are:
- a box that warns when the bands are different ("Different bands (…): the difference comes mostly from the band…"), when one of the two tests has no forecast, or that reminds you of the different skies of the two days with SFI, K and MUF;
- the table Value, A, B, B against A: Over the forecast, Skimmers, Farthest, Average SNR, Continents, Surprises ("same" when nothing changes);
- By continent: skimmers and average SNR;
- the groups Hear you only with B, Hear you only with A and With both, each with how many there are ("None" when it is empty). Tap a skimmer to highlight its arc on the globe.
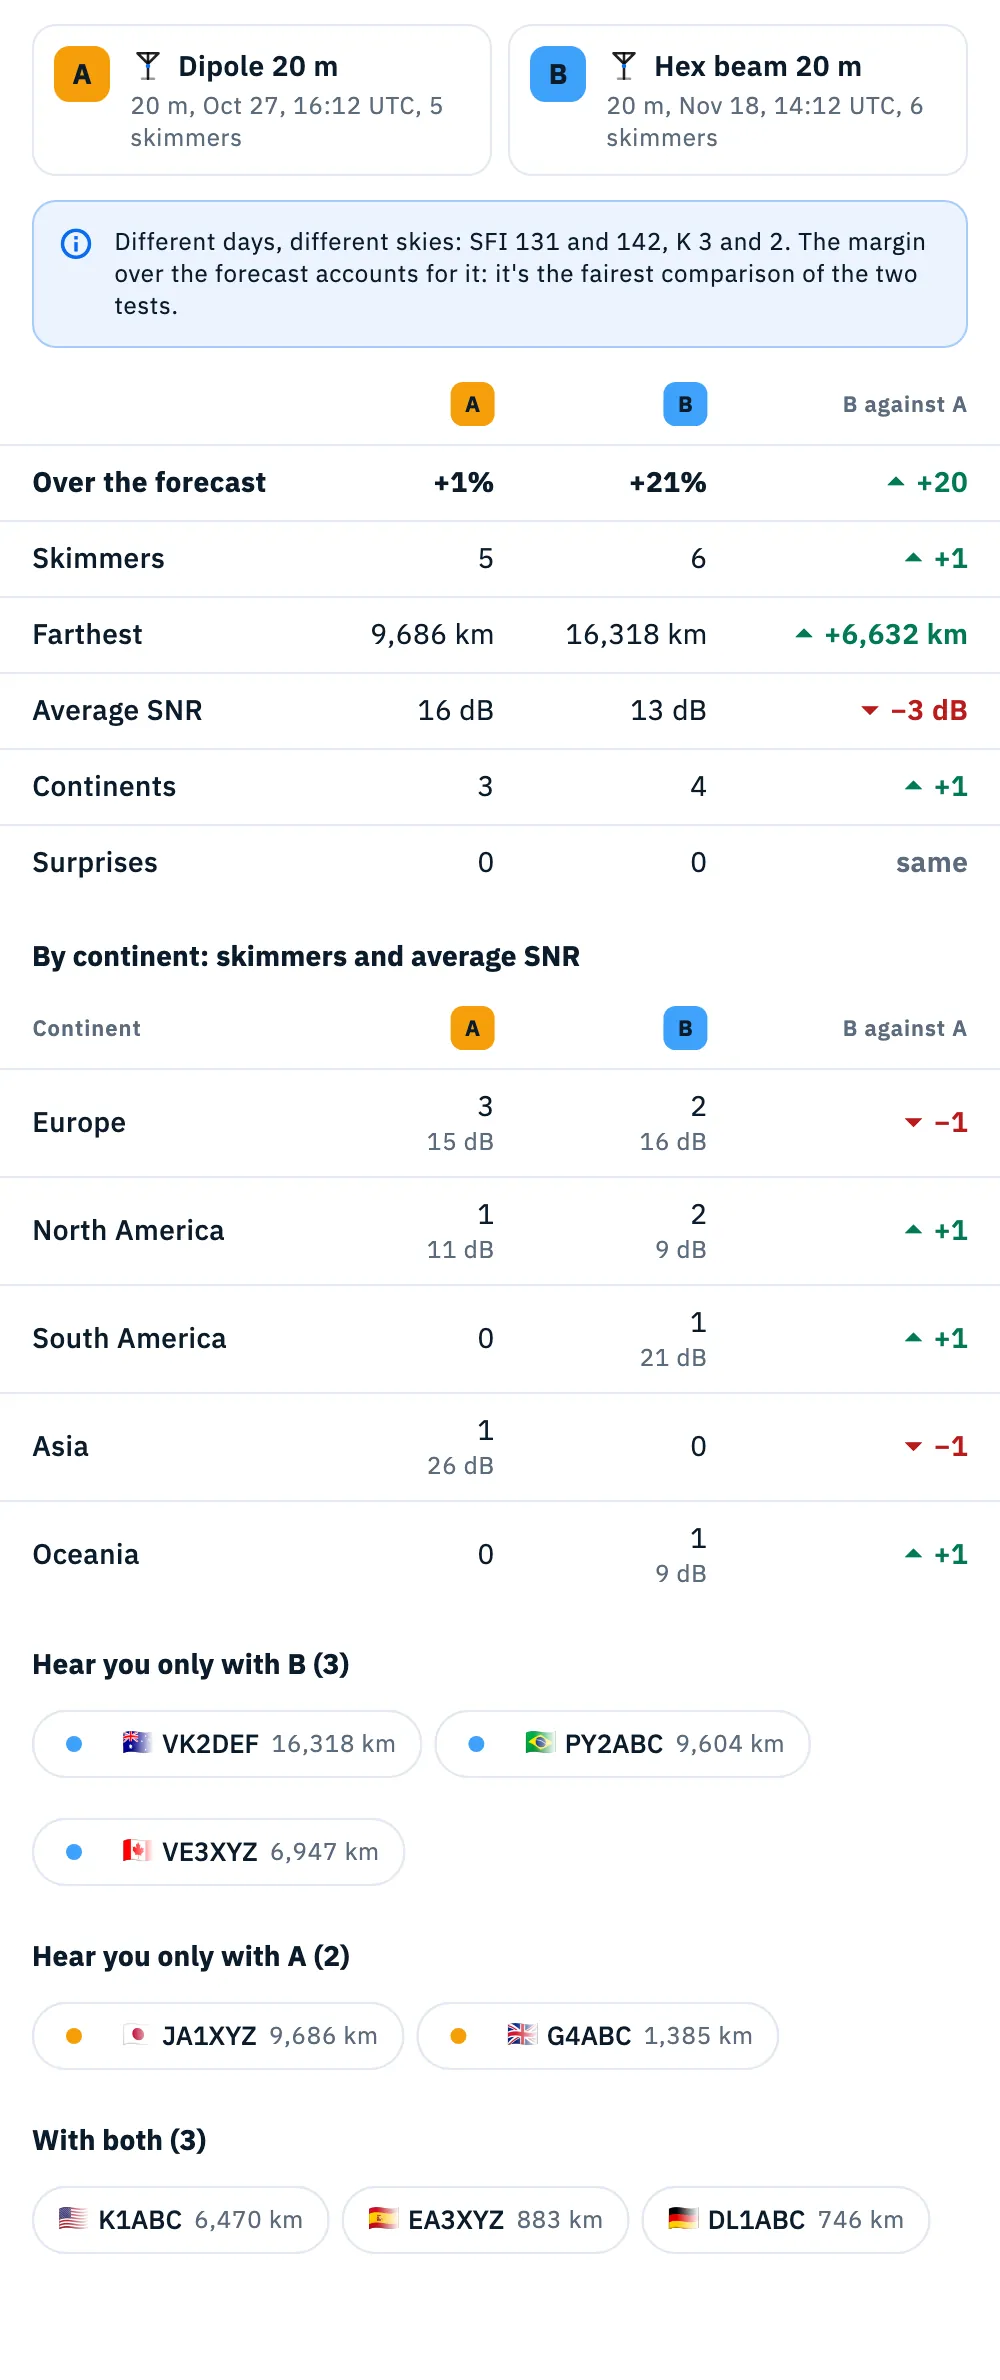
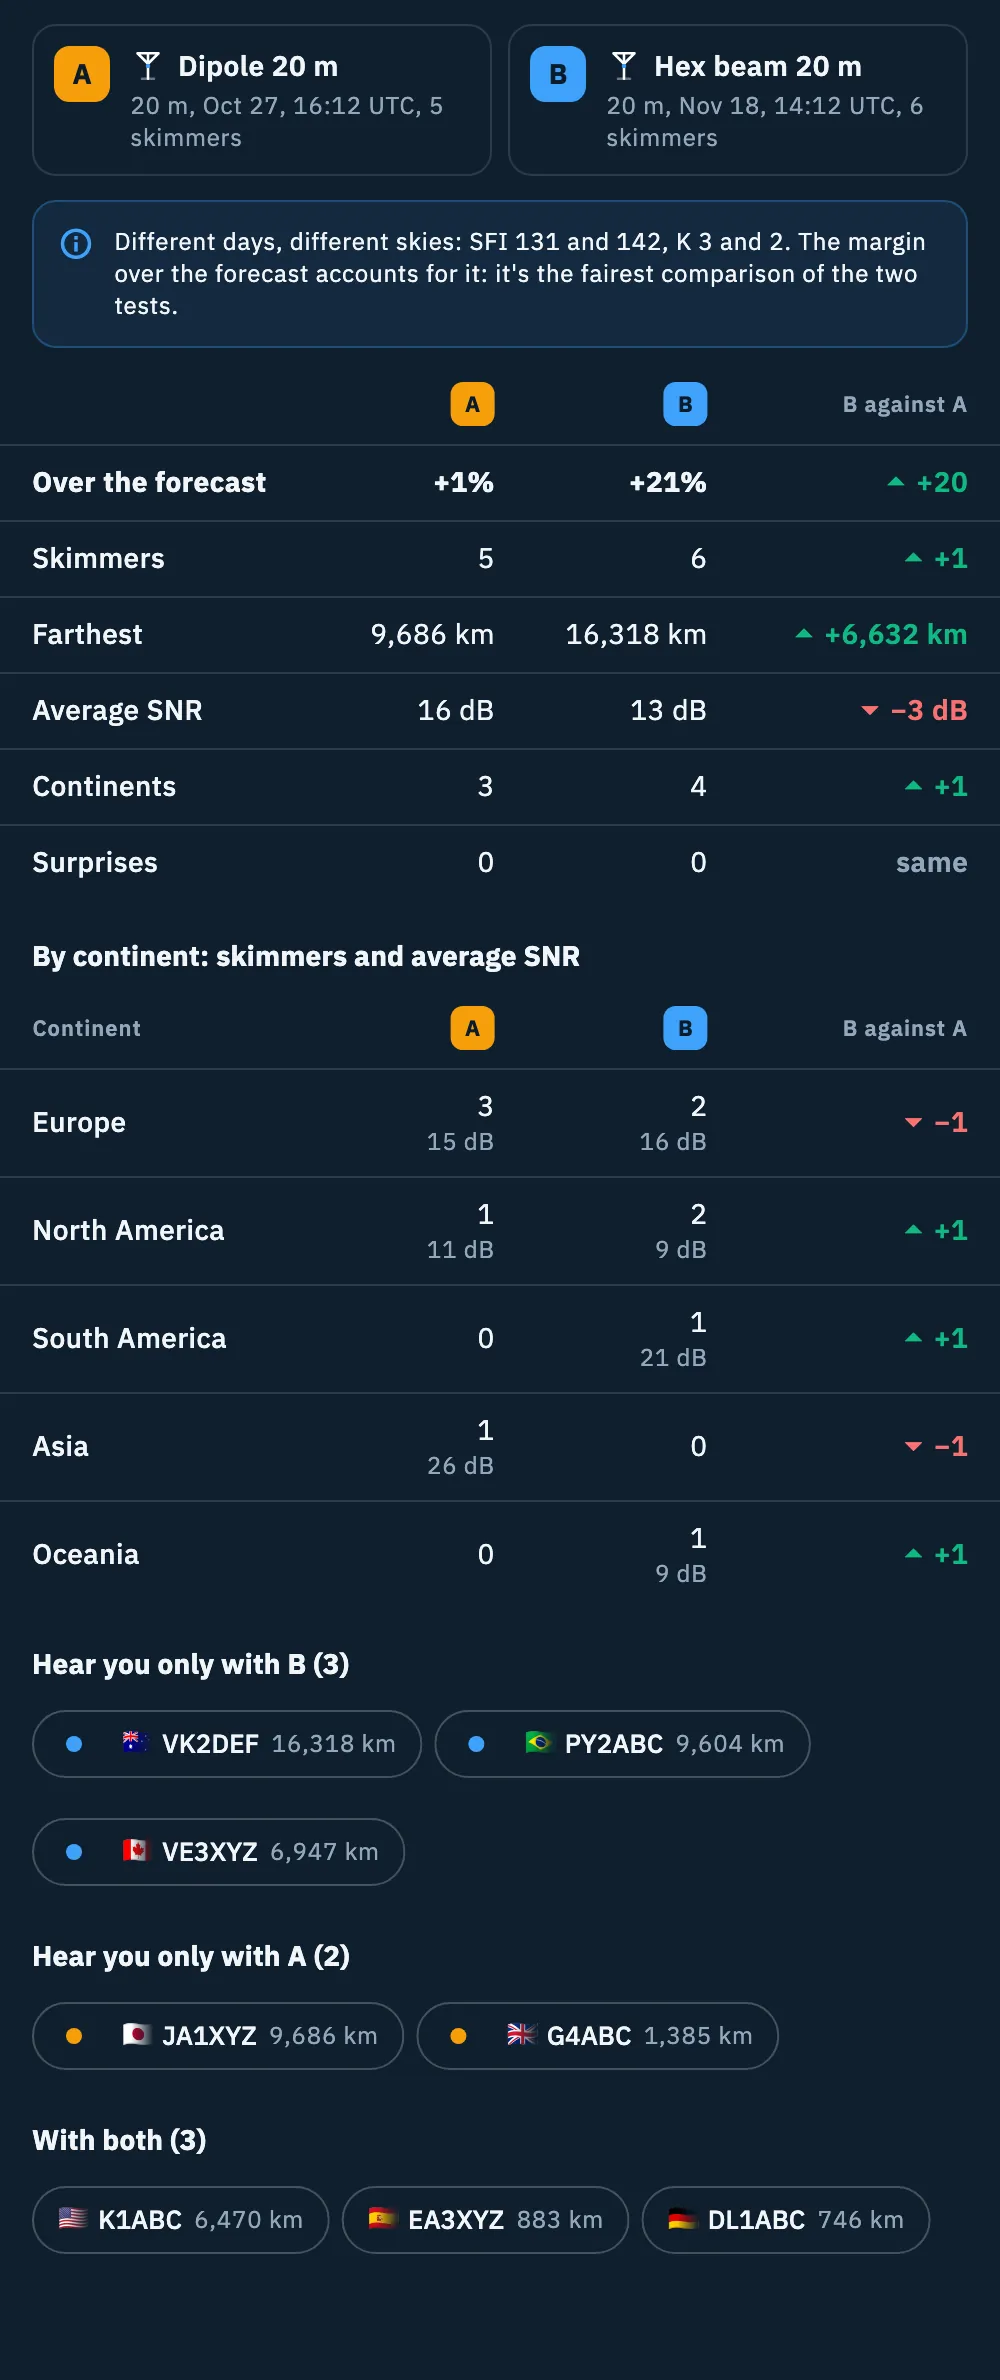
The first row, the margin over the forecast, is the fairest comparison between days with different skies. The Over the forecast and Surprises rows show only when both tests have a forecast; otherwise the comparison stays on the skimmers. To compare two antennas, choose two tests on the same band.
Free and Pro
Phone, tablet and web
- Phone: the Overview is one column; a test opens on its own page and the back button takes you back to where you were.
- Tablet and web: the Overview is in two columns (globe and growth on the left, records, hours and tests on the right); in All tests the list stays on the left and the open test on the right. Tapping a record opens the test beside the list. Compare the tests puts the globe on the left and the tables on the right.
- Web, wide window: a line at the bottom of the page lists the keys.
| Where | Key | What it does |
|---|---|---|
| Overview | Space | Replay / Stop |
| Overview | ← → | Moves the slider in time |
| Overview | 2 | Goes to All tests |
| All tests | ↑ ↓ | Previous or next test |
| All tests | / | Goes to the search field |
| All tests | X | Starts Compare |
| All tests | 1 | Goes to the Overview |
| Compare the tests | A, B, Space | Only A, Only B, A and B |
| Compare the tests | Esc | Back to My coverage |
The keys do nothing while you type in a field. All the shortcuts are in Keyboard shortcuts.
Troubleshooting
- "The saved tests can't be read.": the app could not read your tests. Close the page and open it again; if it happens again, restart the app.
- The sections stay in preview: they need saved tests (1 for the globe and the records, 3 for the growth, 5 for the hours). A test you ran but did not save does not count.
- I don't see the jump in points over the forecast in "How your station grows": it needs at least two tests with a forecast for each of the two antennas, on the same band and with the same radio as the last test with a forecast.
- "No tests with "…"" or "No tests with these filters": the search looks only at the name. Tap Clear the search or Show all.
- "This test is no longer there." or "One of the two tests is no longer there.": the test was deleted, maybe from another device. Go back to the list.
- The comparison has no "Over the forecast" row and no big number: one of the two tests has no forecast (the band is not covered or the forecast has not arrived yet).