
Log summaries and statistics
See how many QSOs, countries, bands and days on air your log has, on a globe and in charts, by week, month or any range, and share it.
FreeUpdated for HamQSO 0.1.19
On this page
The Log overview shows your whole log on one page: how many QSOs, countries, bands and days on air, the globe of your contacts and the charts. For a part of the log (the week, the month, a range you choose) there are the period summaries. Everything is free and updates by itself while you log.
Opening the log overview
- Tap Log.
- At the top of the list of operations, tap Log menu (the three dots).
- Tap Log overview.
You can also get there from All QSOs: tap the chart icon at the top (Log overview).
The overview counts the whole log, every operation, and updates by itself when you log, edit, import or sync QSOs.
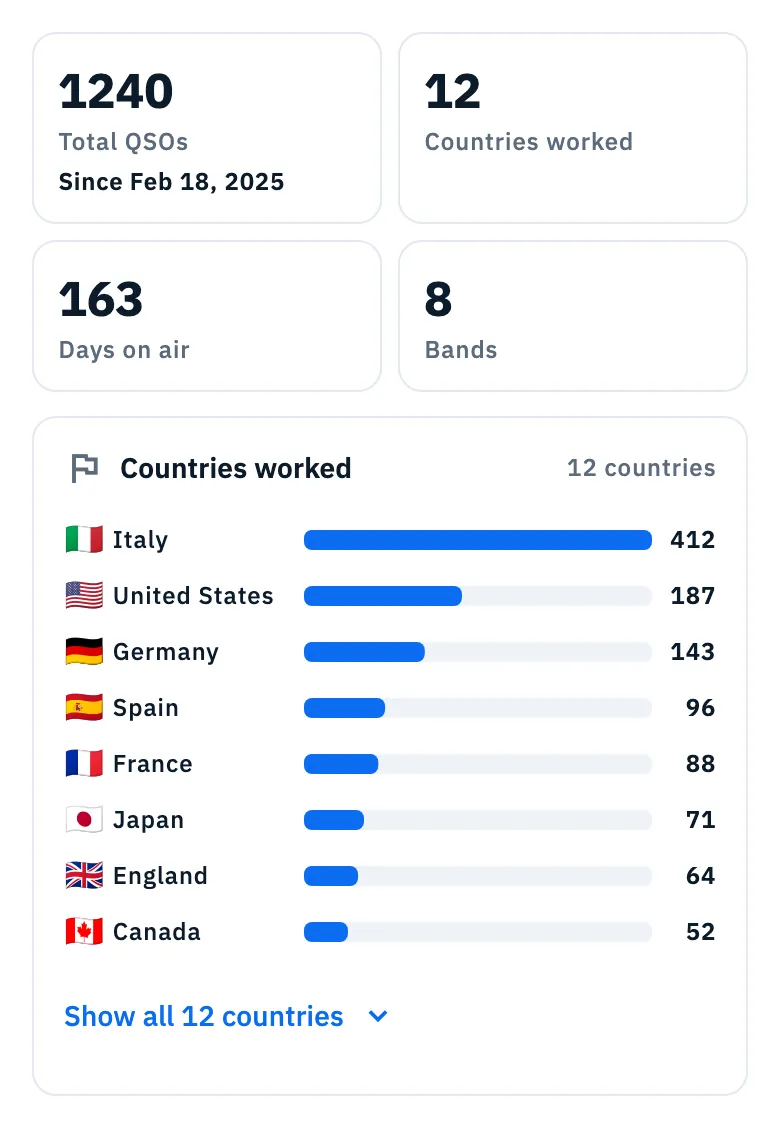
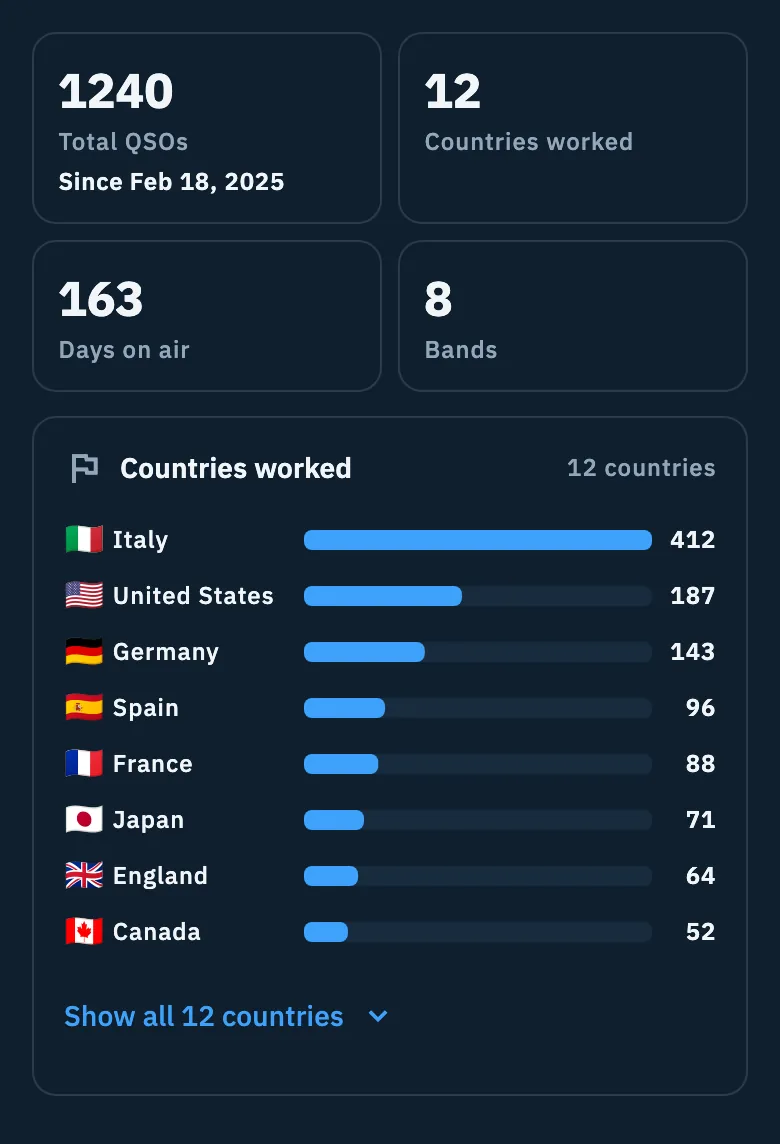
What the overview shows
| Block | What it shows |
|---|---|
| Total QSOs | How many QSOs the log has, with «Since …» and the date of the first QSO. |
| Countries worked | How many countries (DXCC entities) you have worked. |
| Days on air | On how many different UTC days you made at least one QSO. |
| Bands | How many amateur bands you have used. |
| QSO map | The globe with your QSOs and the arcs from your station (see below). Beside the title, how many QSOs are on the map. |
| Countries worked (card) | The ranking of countries, most worked first, with flag, name and number of QSOs. |
| Bands and modes | Two bar charts: QSOs per band, in the band colors, and QSOs per mode. QSOs without a band count as «Other frequencies». |
| Activity over time | Bars of QSOs per period. Choose Months (the last 12 months) or Days (the last 14 days), up to the day of your last QSO. The bars start at the first period with QSOs: a new log shows no empty months before its first contact. |
| US states worked | How many of the 50 US states you have worked (for example «23/50») and the grid of the 50 states: the worked ones in color with their flag, the missing ones in grey. It shows only when at least one QSO has a US state. For awards see Countries and US states worked. |
Months and days are in UTC, like the whole log.
At the top of the overview the HamQSO eQSL cards may also show (the invitation to send it to the QSOs already in your log, and the queue of sends): see Sending eQSLs.
Reading the charts
- The horizontal bars all start from zero on the same scale; the name is always written and the number is beside it. The color only repeats the band or the mode.
- Rankings with more than 10 entries (countries, bands, modes) show the first 8. Tap Show all 12 countries, Show all … bands or Show all … modes to open them in place, and Show less to fold them again. The Activity over time chart is always whole.
- The summaries of an operation or of a period also have the QSOs per hour (UTC) histogram: 24 bars, from 00z to 23z, with a line at the peak. Tap a bar to see the hour and its number of QSOs (for example «14z: 9 QSOs»); tap again to hide them.
- Without QSOs a chart says «No data».
With VoiceOver or TalkBack each chart reads its title and then its rows one by one (for example «Germany, 143 QSOs»).
The QSO globe
The globe of the QSO map is the same one you find in the Map of an operation, in the Summary of an operation and in the detail of a QSO. Each QSO is a colored dot, with an arc from your station to the other station. When it opens the globe frames all the QSOs.
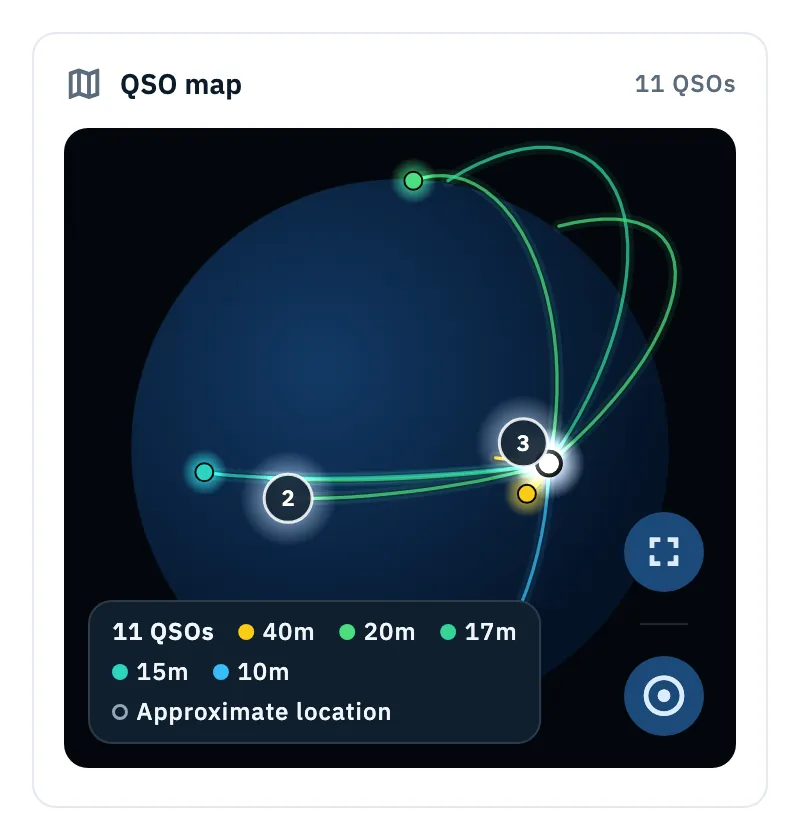
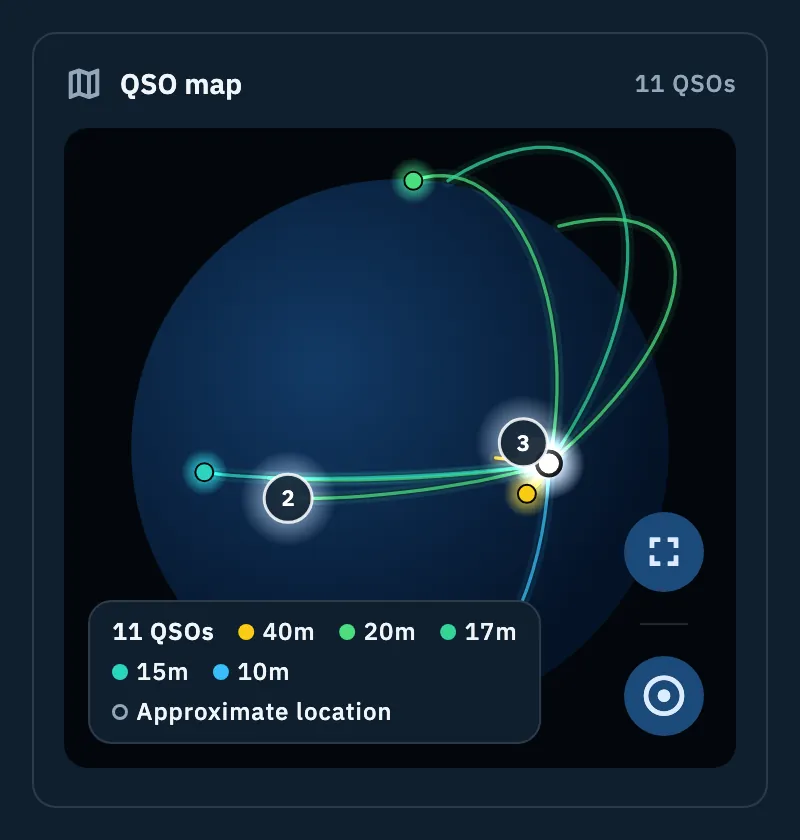
- Turn the globe with one finger; zoom in and out with two fingers. In the overview, which scrolls, one finger turns the globe only sideways: moving up or down scrolls the page, and so does the mouse wheel. To turn and zoom it freely, open Full screen.
- Tap a dot: its card shows flag, callsign, band, mode, time and distance. Tap the card to open the QSO.
- Where several QSOs overlap there is a bubble with a number. Tap it to zoom in: close up, a bubble of up to 8 QSOs opens in a ring around the point, each with its callsign. Tapping a bubble of more than 8 QSOs opens a list to pick one.
The buttons on the edge of the globe:
| Button | What it does |
|---|---|
| Show all QSOs | Brings the view back onto every dot. |
| Full screen | Opens the globe full screen; Exit full screen, in the same place, goes back to the overview. |
| Map settings | Opens the settings below. |
| Setting | What it does | Default |
|---|---|---|
| Lines from my station | Turns the arcs from your station to the QSOs on or off. It is off and cannot be changed when the station location is missing: «Needs the station location». | On |
| Color | By band or By mode: colors the dots. The legend under the globe says what each color means and lists only the entries present; «Other» are the QSOs without a band. | By band |
The globe settings stay saved on this device.
A QSO without a locator is shown at an estimated place (from the callbook, the US state or the country): it is a hollow dot with a dashed arc, and its card says «Approximate location». QSOs added while you watch the globe, or saved less than 2 minutes before you open it, leave a trail.
With a keyboard, when the globe is selected: ← and → move from one QSO (or bubble) to the next, Enter or Space open, Esc closes the card (full screen, it goes back), + and − zoom in and out. See Keyboard shortcuts.
Sharing the overview as an image
- In the Log overview tap Share (top right).
- The Summary image opens: the globe with the arcs of the QSOs, the number of QSOs, the title «Log overview» with the date of the first QSO, countries, days on air and bands, and the link to your live page.
- Choose the format: 9:16 for «Instagram and Facebook Stories, WhatsApp Status, TikTok.» or 4:5 for «Instagram and Facebook feed.». The first time it is 9:16, then the app remembers the format used last.
- Tap Share and choose the app.
The image goes out with the text «Log overview: 1,240 QSOs, 12 countries. Logged with HamQSO» and the link to your live page (see The activation live page). Without a callsign in your profile the link leads to the HamQSO site.
The image is always dark and follows neither the theme nor the text size of the device. Where the 3D globe cannot be drawn, the image comes out with a plain sphere.
Period summaries in the Log
When a week (Monday to Sunday) or a month in which you made QSOs ends, a dark card shows at the top of the list of operations in Log: Your week on the air or Your month on the air, with the number of QSOs and See the summary.
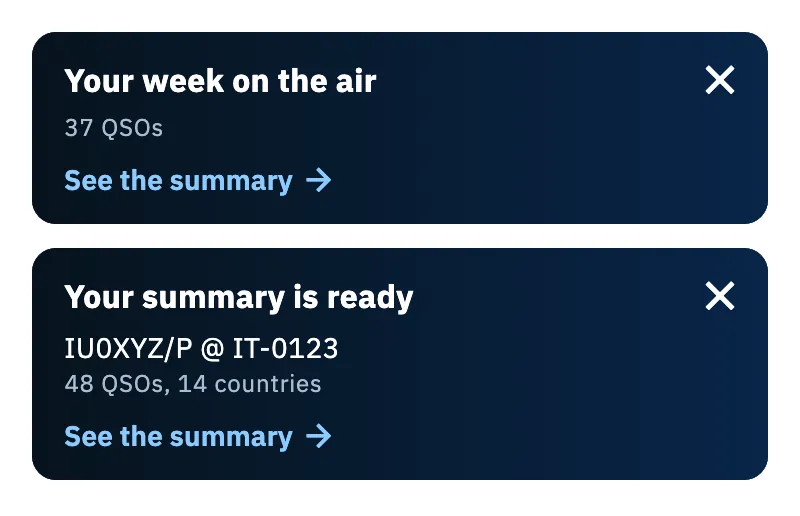
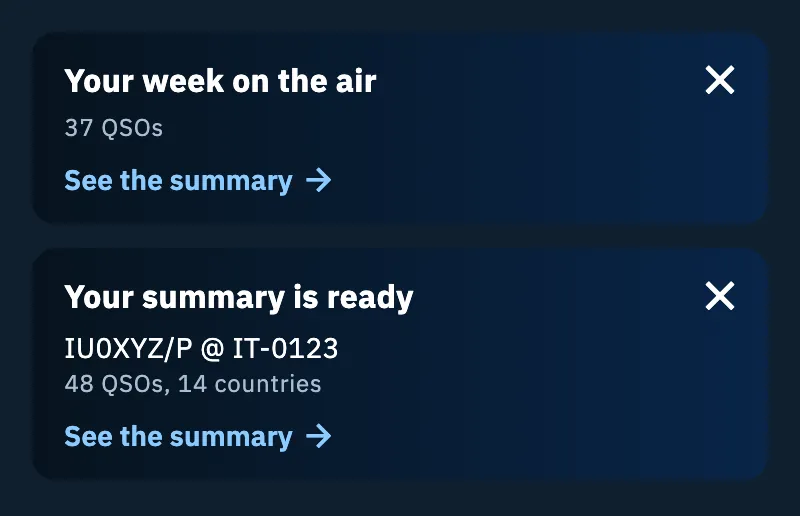
- Tap the card: the summary of every QSO of the week or month just ended opens, whatever the operation.
- Scroll through the numbers, the milestones, the globe, the QSOs per hour (UTC) chart, the bands and the modes; tap DX Replay for the video of the period.
- Tap Share for the image or the video of the period (see Sharing an operation and DX Replay).
The card stays for the whole following week (or month), until you open it or remove it with the ✕. Once opened or removed, it never comes back. Only one period card shows at a time: when a month and a week end together, the month comes first.
The period summary is not an operation: it has no photos, settings, export or Reopen operation. When the period has no QSOs you read «No QSOs last week» or «No QSOs last month».
Your summary is ready
When an operation left open closes by itself, or you close it from the question shown when you create a new operation, the Log shows the card Your summary is ready, with the name of the operation, its QSOs and countries. Tap the card to open the operation on its Summary, or the ✕ to remove it.
- Only one card shows at a time, the most recent.
- It shows only for operations with at least one QSO and a last QSO less than 3 days old: an old imported log closes silently.
The Summary of an operation is explained in Operation summary, milestones and photos.
The period of a station log
A Station log is always open (see Organizing your operations), so you look at its numbers by period.
- In Log, open your station log.
- Go to Summary, Map or Statistics: above them is the Period selector.
- Choose Today, Week, Month or Year. With a keyboard the selector is a single Tab stop: the arrows move between the periods.
Days, weeks, months and years are those of your local time, and the week runs Monday to Sunday. The first time the log opens on Week; then the app remembers on this device the period you chose, for each station log. At midnight, on Monday or on the 1st of the month the period moves on to the new one by itself. The Log section has no selector.
With no QSOs in the period the Summary says «No QSOs today», «No QSOs this week», «No QSOs this month» or «No QSOs this year».
Generating the summary of a period
In a station log you can create the summary of a part of the log, as at the end of an operation.
- Open the station log, Log section. At the top, where operations have Close operation, is the row «A summary of the latest QSOs, the week or a range.» with Generate summary. It is also in More actions (the three dots).
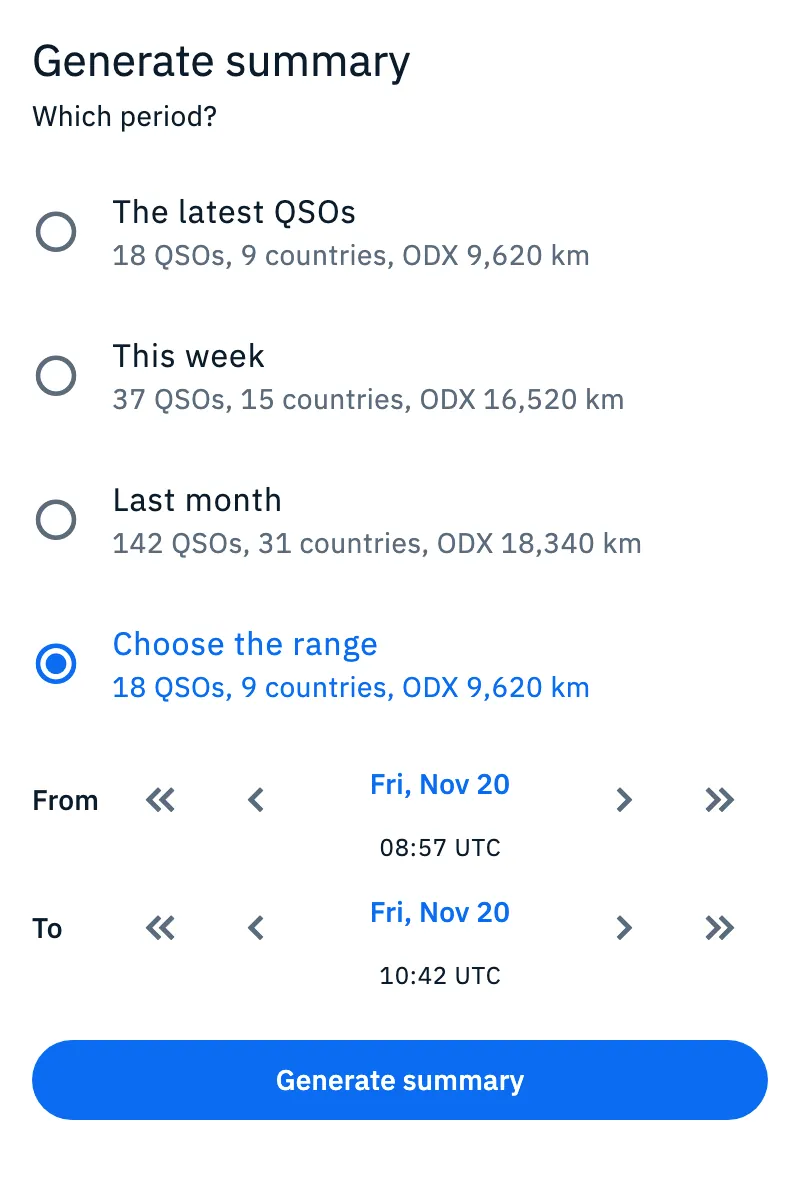
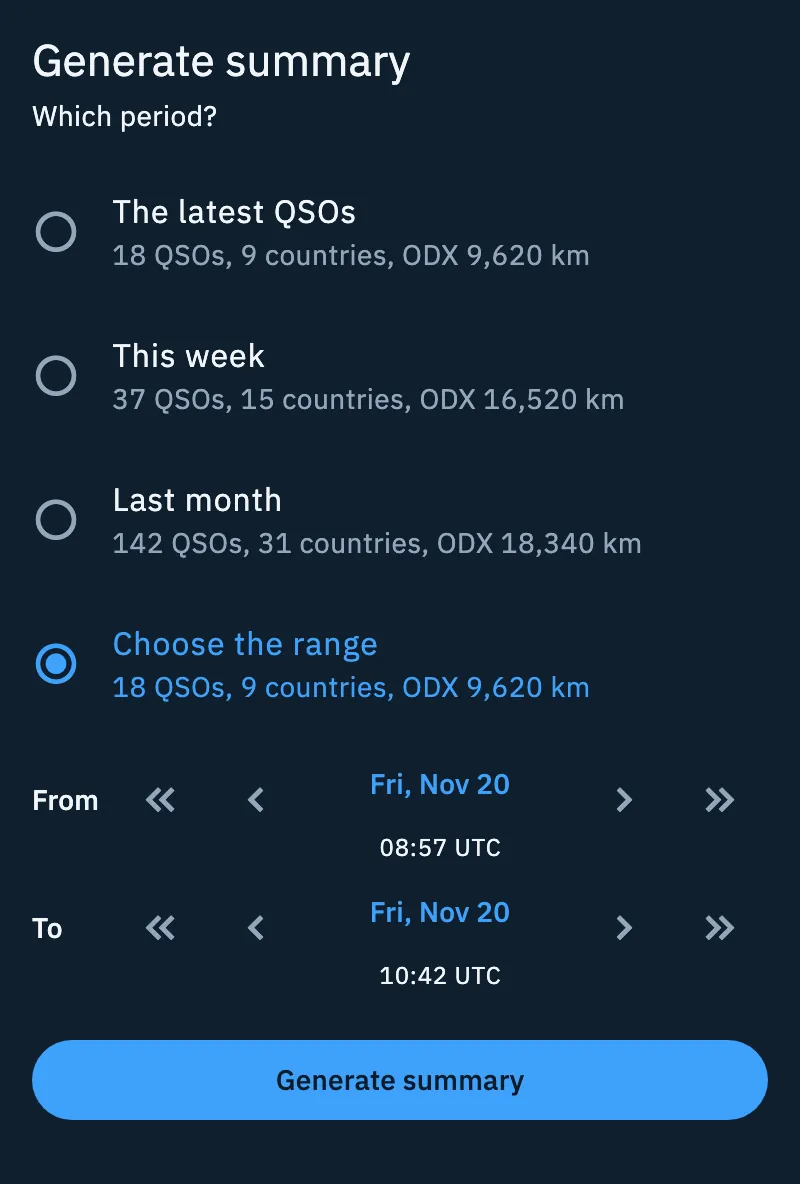
- Tap Generate summary. The sheet asks «Which period?» and under each entry shows how many QSOs and countries it has and the ODX, the farthest QSO:
- The latest QSOs: those after the last pause of more than 60 minutes.
- This week: Monday to Sunday.
- Last month: the whole month before this one.
- Choose the range: you set From and To.
- For Choose the range move From and To (UTC day and time) with One day earlier, Half an hour earlier, Half an hour later, One day later, or tap the date to pick the day from the calendar. The range stays between the first and the last day of the log, and To includes the whole minute shown.
- Tap Generate summary.
After the finale on the globe the Period summary page opens, with DX Replay and Share. Nothing is saved: to see it again, generate it again.
Phone, tablet and desktop
- On a phone the Log overview is one column.
- On a tablet and on a computer the QSO map and Activity over time are on the left, the numbers, countries, bands and modes and US states on the right.
- The summary of a period has one column on a phone and two from tablet size up.
Troubleshooting
| Message | What to do |
|---|---|
| «Your overview starts with the first QSOs» | The log is empty: log or import some QSOs (see Logging a QSO and Importing an ADIF file). |
| «Could not prepare the overview» | Tap Retry. |
| «Stations show up here when they have a locator or a known country.» | No QSO has a place: add the locator or link a callbook. |
| «Needs the station location» | The arcs are missing: add the locator of the station (see Station profiles) or of the operation. |
| «I couldn't create the image» | Tap Retry, or Go to the text to send only the text, which has the same link. |
| «This log has no QSOs yet.» | The station log is empty: there is nothing to summarize. |
| «No QSOs in this range: move the start or the end.» | Generate summary is off: widen From and To. |
| «Can't read the log. Try again.» | Tap Retry in the sheet. |