
Reading the test result
Understand a coverage test: who heard you and how far, in which directions, against the forecast, and the conditions of the sky at that moment.
Free and ProUpdated for HamQSO 0.1.19
On this page
At the end of a coverage test the app shows you who heard you: the Reverse Beacon Network skimmers on the globe, a big number that sums up the test, the comparison with the forecast and four detail tabs. Seeing the result is free; saving and sharing it are Pro features.
Getting to the result
- Run the test (see Running a coverage test or Coverage test without CAT).
- When the listening ends, the page replays the arcs from the first skimmer to the last and shows the big number, with the sentence "The listening is over. The result compares who heard you with the forecast of this moment."
- Tap See the result.
If reduced motion is on in your device, the result appears at once, with all the arcs already drawn.
You find the same result, with the same tabs, when you open a saved test (see My coverage and comparing tests).
The big number and the true titles
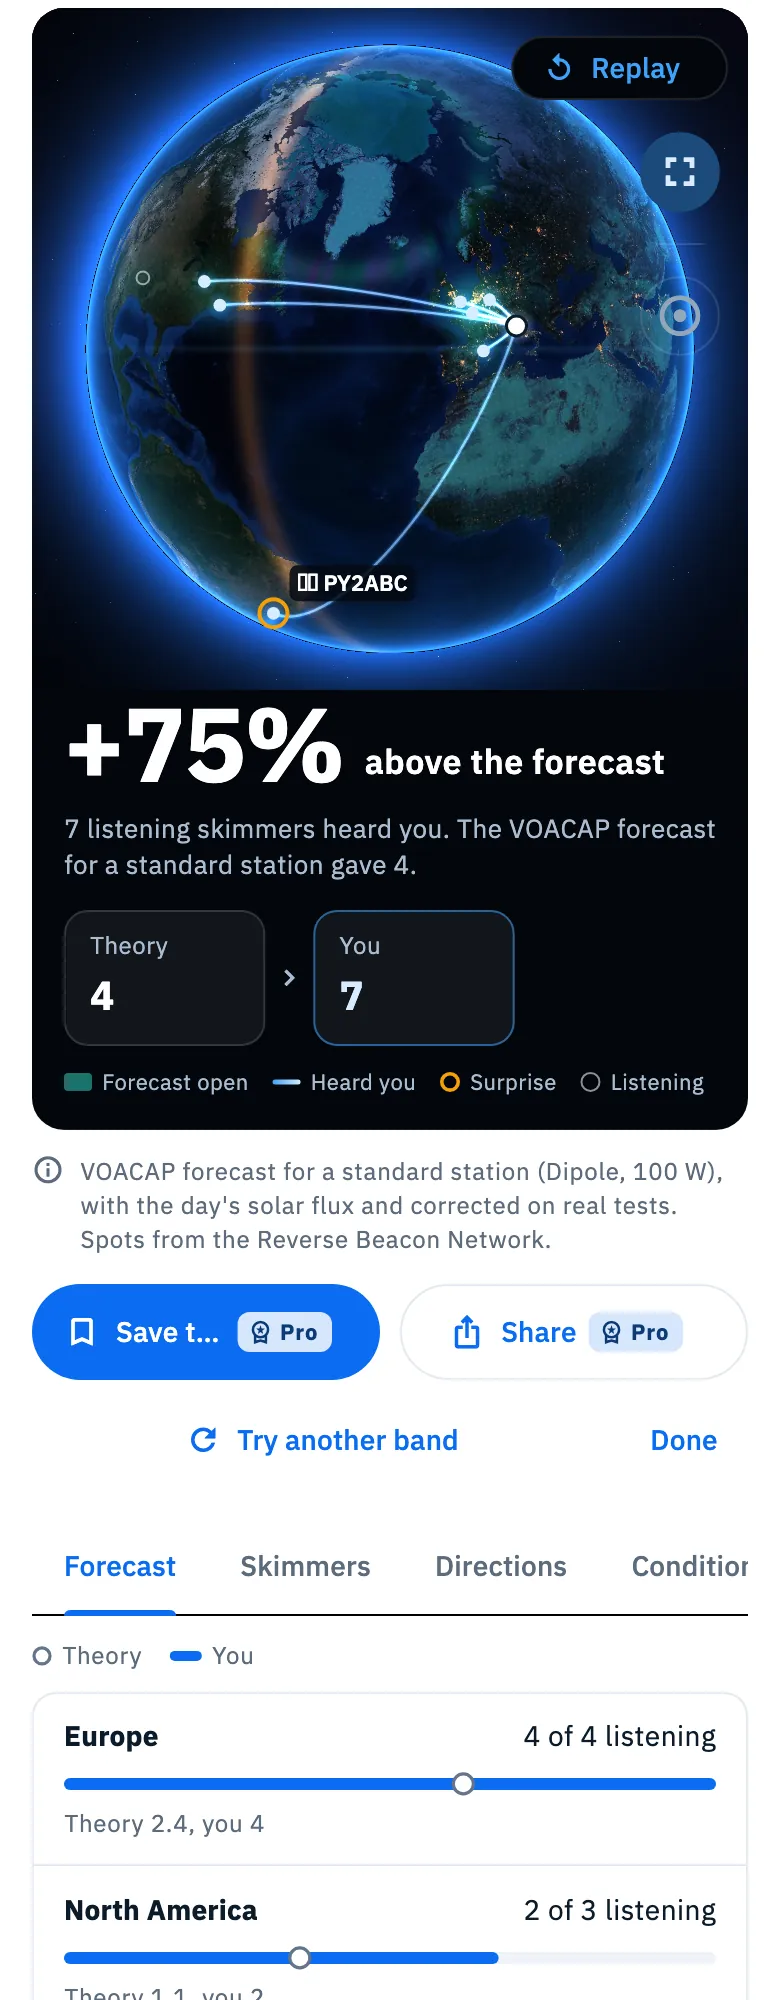
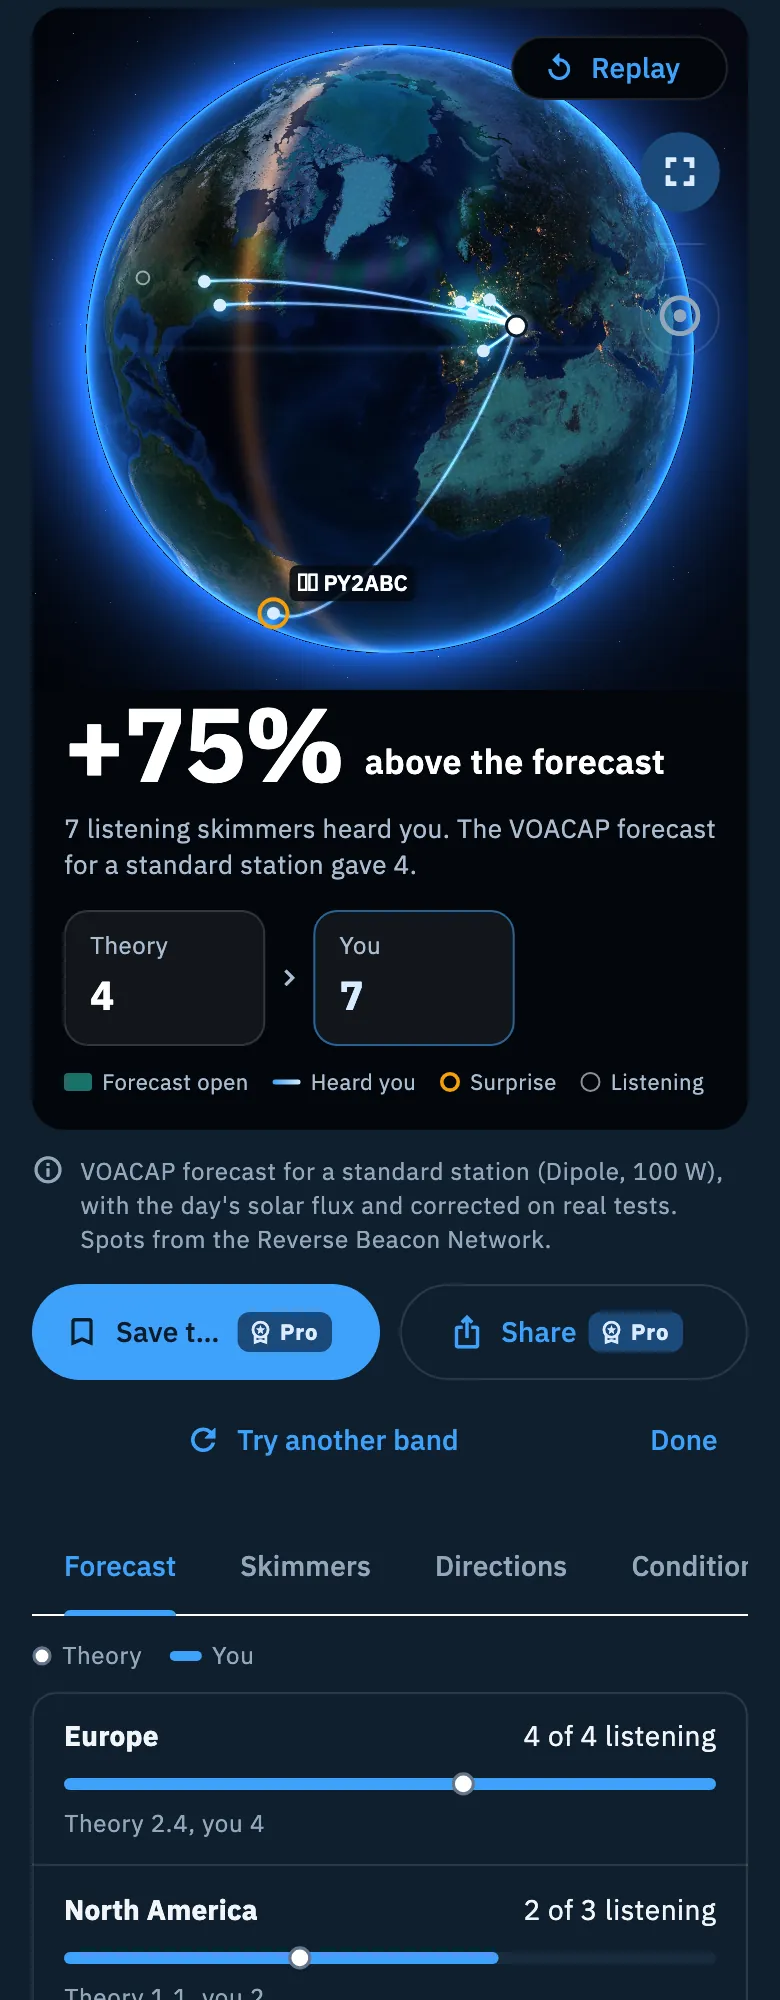
Under the globe there is a big number with words beside it (for example "+75%" and "above the forecast") and, below, a line that proves it with the measured data (for example "7 listening skimmers heard you. The VOACAP forecast for a standard station gave 4.").
This is the true title of the test: the app tries every kind of title, keeps only those that are true for your data and shows the strongest.
| Title | When it is true |
|---|---|
| Above the forecast | At least 25% more skimmers heard you than expected (at least 3 skimmers expected are needed) |
| New continent | A skimmer heard you on a continent none of your earlier tests had reached (at least 3 saved tests before are needed) |
| Distance record | The farthest skimmer beats that of all your earlier tests (at least 3) |
| Skimmer record | More skimmers than in any of your earlier tests (at least 3) |
| Record over the forecast | Your highest margin ever, at least +25%, with at least 3 tests before |
| Growth on the test before | At least 20 points over the forecast more than your last test on the same band with the same radio, at a similar UTC hour (within 3 hours) and in the last 30 days |
| More skimmers than usual | At least 8 skimmers more than the median of your last 10 tests on that band (at least 3 are needed), and at least 50% more |
| Far with few watts | 10 W at most and the farthest skimmer beyond 5,000 km |
| Heard where the forecast gave little | A skimmer heard you where the theory gave less than 5%, and such cases are at most a third of those that heard you |
| The farthest | The farthest skimmer that heard you, always true when someone heard you |
| Quick first spot | The first skimmer heard you within 10 seconds of the CQ |
| No skimmers | Nobody heard you: "No skimmers for IU0XYZ on 40 m" |
Records are worked out against the tests you had saved before: a record stays the record of its day even if you delete a test later. The titles that speak of the forecast (above the forecast, record over the forecast, growth, heard where the forecast gave little) only come out on the bands where the forecast is shown.
When you share a test you can choose among its true titles; a test with no skimmers is saved for comparison but not offered for sharing (see Saving and sharing a test).
The three levels and the legend
Under the big number are the levels, in a row with an arrow:
- Theory: how many skimmers you could expect according to VOACAP for a standard station (Dipole at 10 m, 100 W), the same for everyone, with the day's solar flux and corrected on real tests.
- Today's sky: the forecast corrected with the measure of an ionosonde. It appears only where the comparison is verified (for now on no band).
- You: how many skimmers actually heard you.
Tap a level to see only that one on the globe; tap it again to see everything.
Under the levels, the legend explains the marks of the globe: Forecast open (the areas where the forecast gave the band open), Heard you (the arcs), Surprise (a skimmer that heard you where the theory gave less than 5%) and Listening (the skimmers listening that did not hear you).
The globe
The globe moves:
- Turn it with a finger or the mouse; on the keyboard use the arrow keys.
- Zoom in and out with two fingers or the + and − keys. The mouse wheel zooms when the globe is not in a page that scrolls (tablet, computer, full screen); on a phone the wheel scrolls the page.
- Tap Replay (top right) to replay the arcs in time order.
- Under Replay there are two icons: Full screen opens the globe over the whole app, with the big number, the levels and the legend (tap Exit full screen to go back); Show all skimmers brings the globe back to the view of the whole test.
On the globe, the farthest skimmer has a label with its flag and callsign. The first time you open a result on a device, the globe makes a small movement to show you that it turns; after that it does not.
On a phone the globe sits in the page: one finger turns it sideways, while a vertical movement scrolls the page; two fingers zoom and move it. On tablet, computer and full screen one finger turns it in every direction. Up close, land and borders are drawn sharper.
The source line and the actions
Under the globe a line says where the numbers come from, for example "VOACAP forecast for a standard station (Dipole, 100 W), with the day's solar flux and corrected on real tests. Spots from the Reverse Beacon Network."
If the forecast has not arrived you read "Spots from the Reverse Beacon Network. The forecast is not available now: it will appear on its own as soon as it is ready; the test is complete." While it is missing, the result shows only the You level and no Forecast tab. If you save the test, the app asks for it again when you open My coverage or that test, for 24 hours after the end of the test; when it arrives, the big number, the levels and the titles complete themselves.
Then come the actions:
| Button | What it does |
|---|---|
| Save the test | Saves the test with a name; once saved it turns into a check mark |
| Share | Opens sharing: the image of the test with one of its true titles and, if you saved the test, a public link |
| Try another band | Goes straight back to a new test |
| Done | Closes the test |
The four tabs
Under the actions are the Forecast, Skimmers, Directions and Conditions tabs. The first one opens; on the bands without the forecast there is no Forecast tab and the first is Skimmers.
Forecast
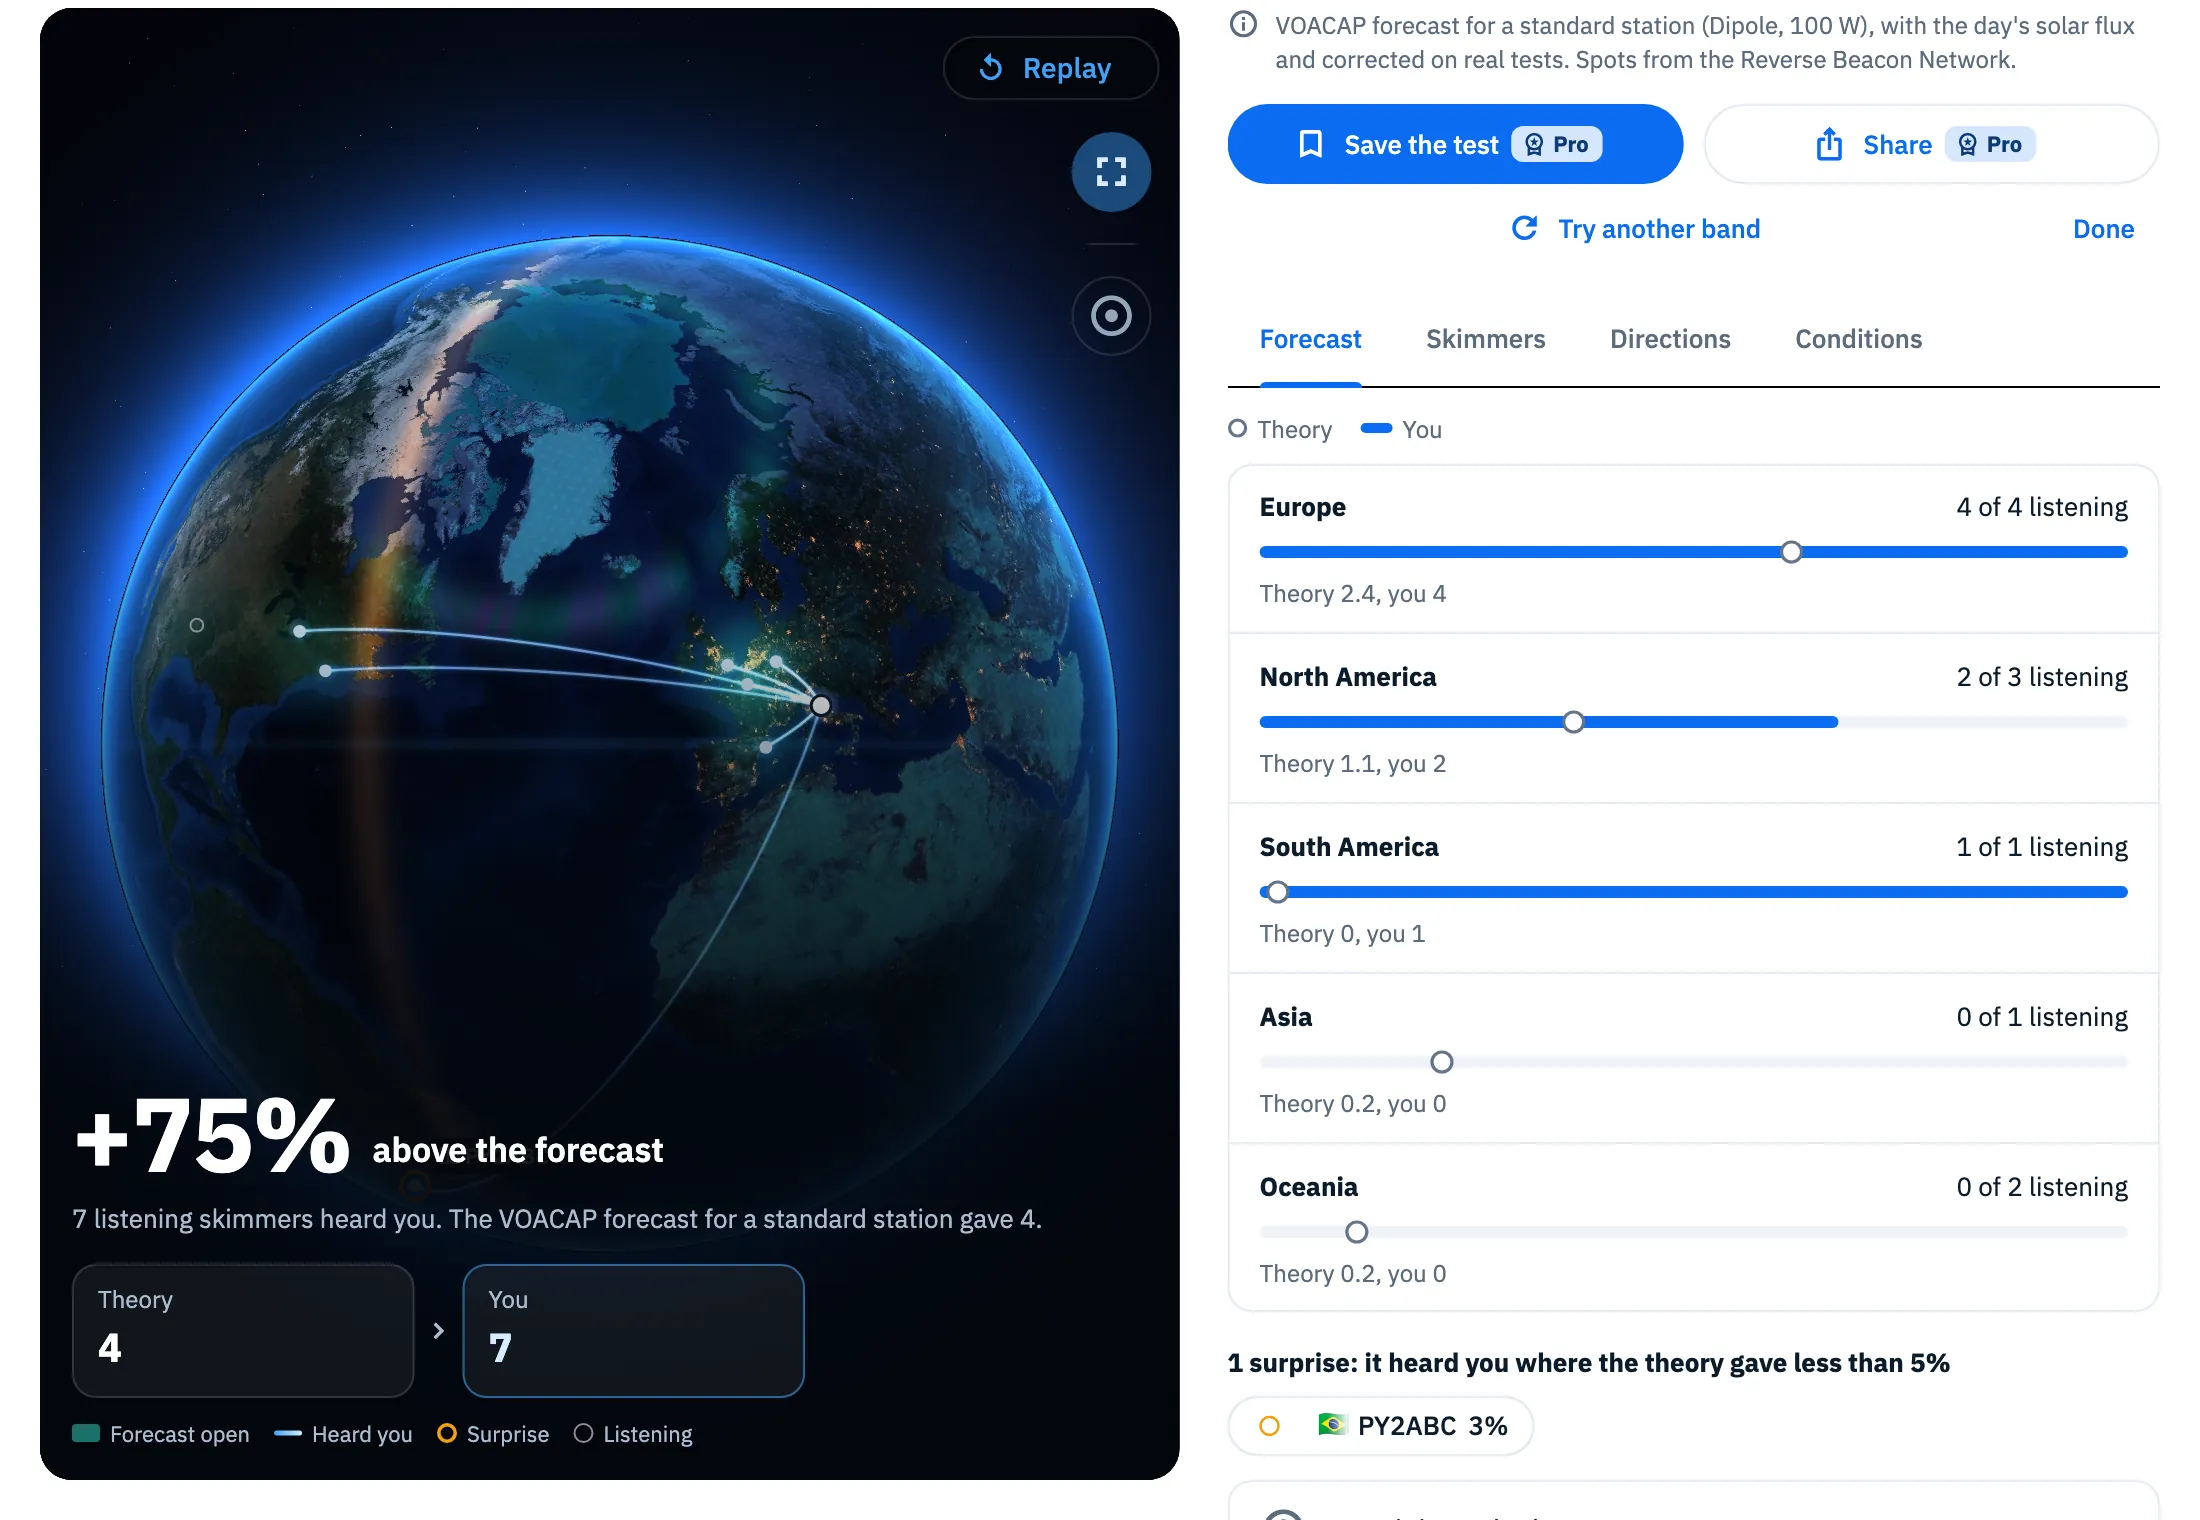
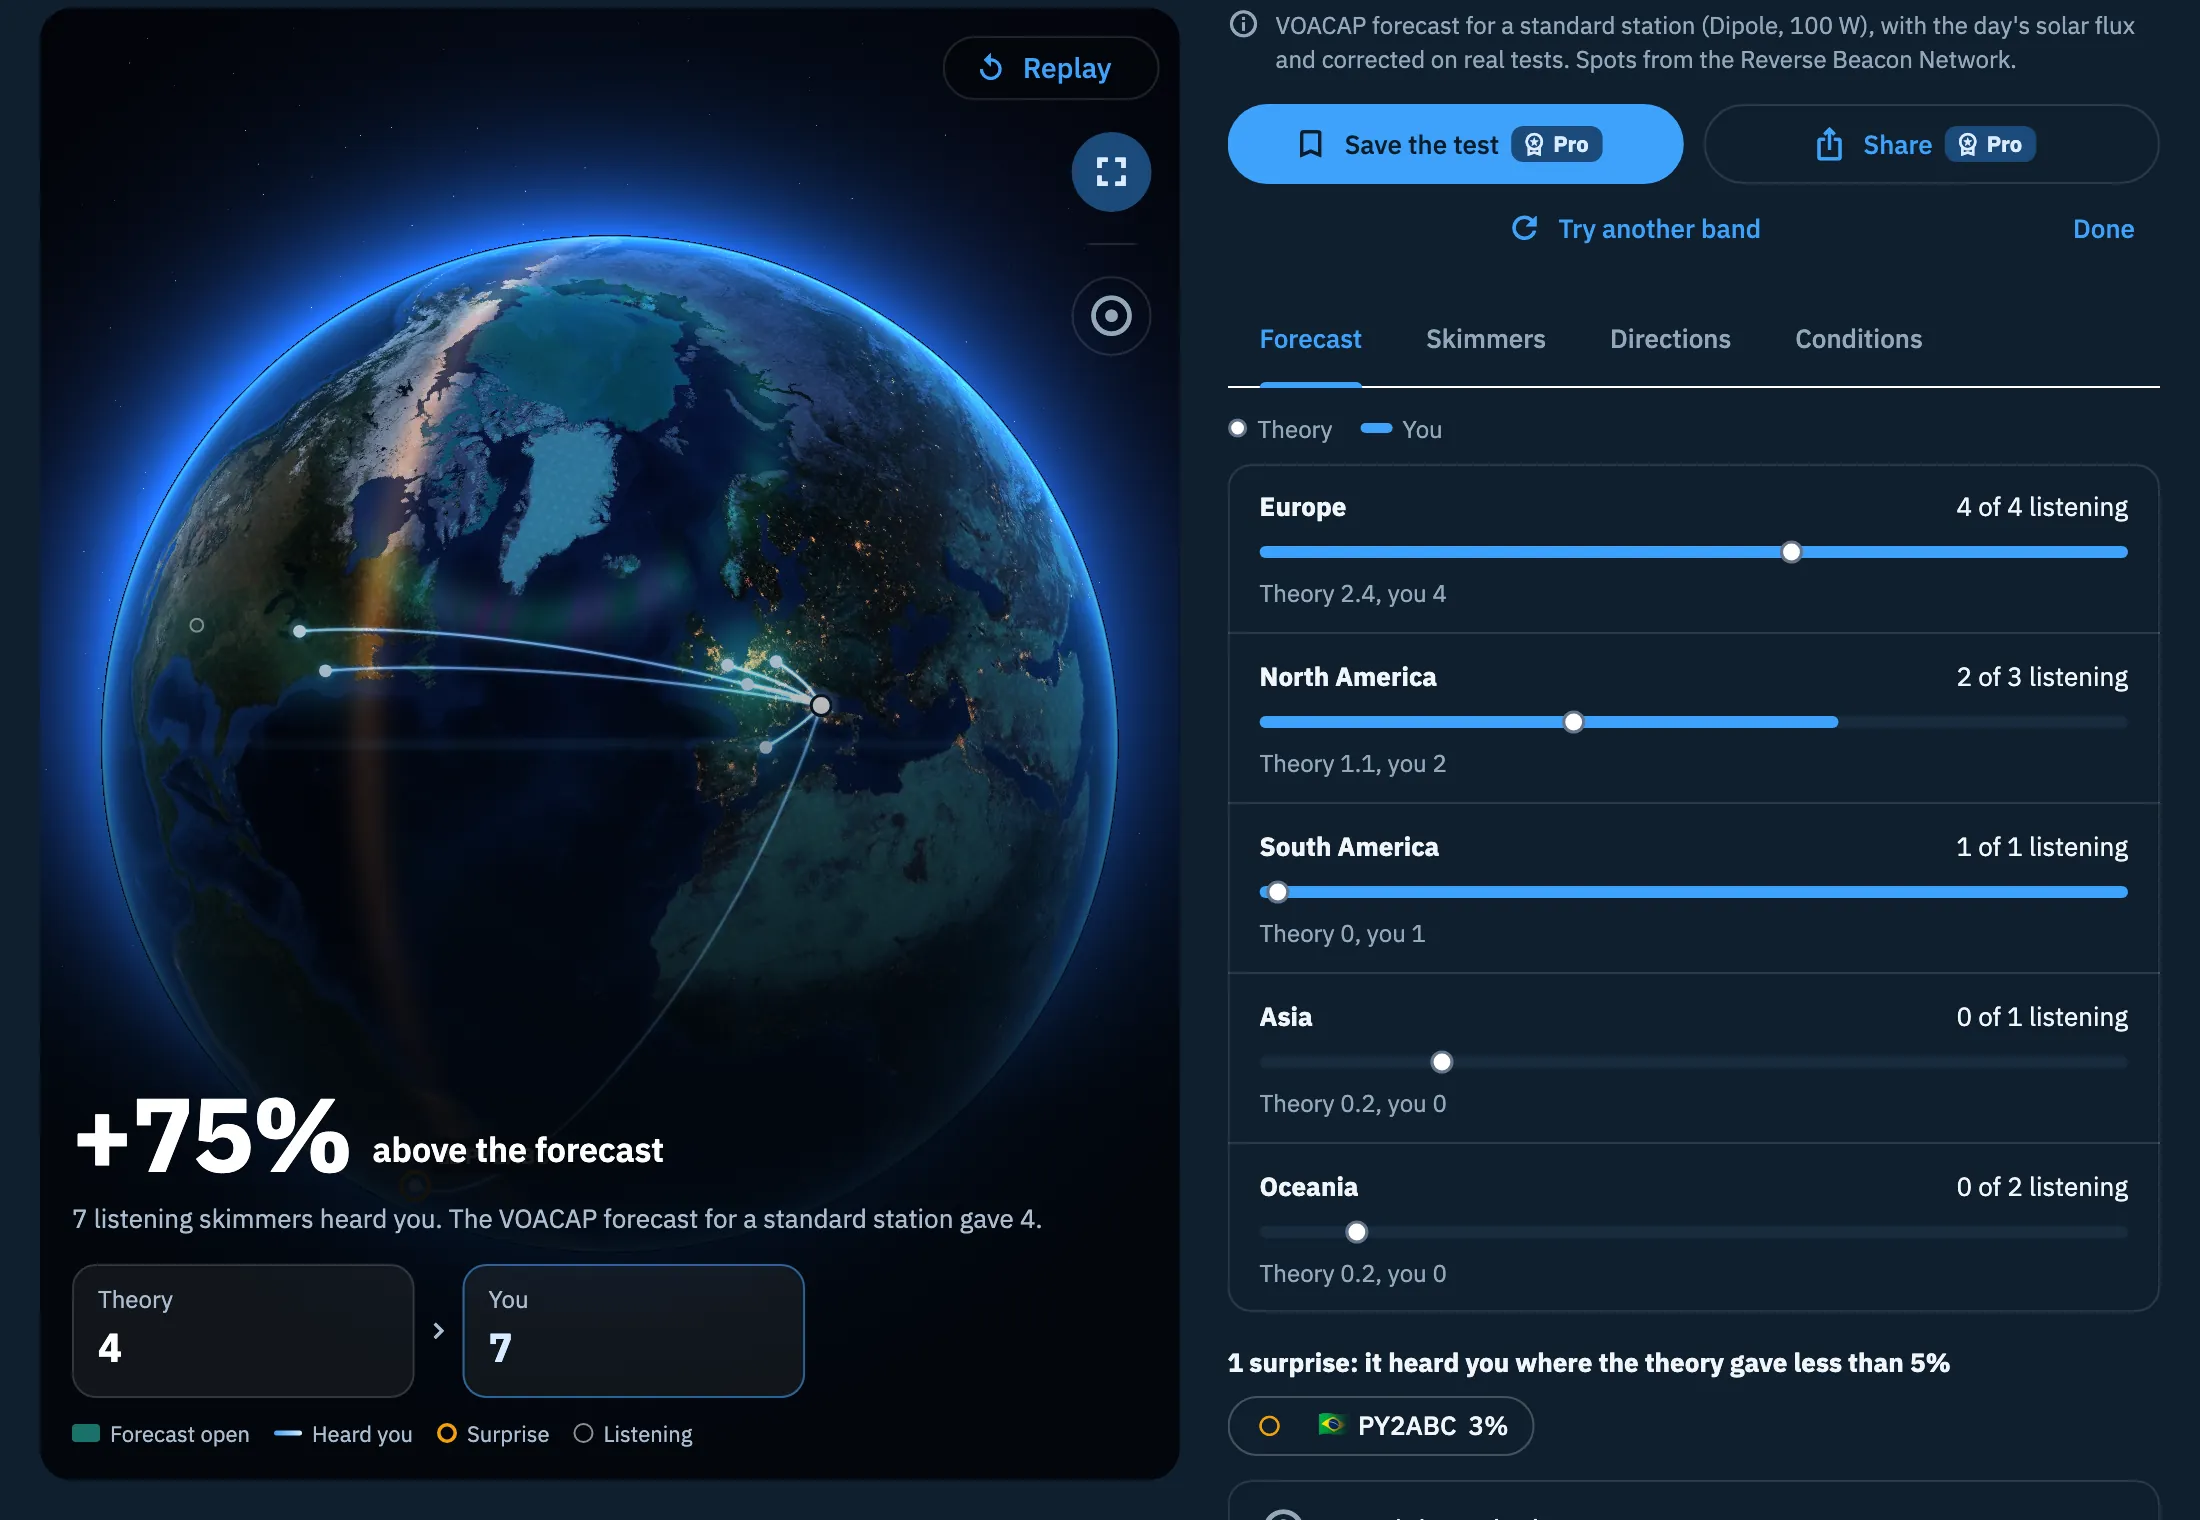
It compares the forecast with who heard you, continent by continent:
- at the top the legend: a circle for Theory, a diamond for Today's sky (when it is there), a bar for You;
- for each continent with skimmers listening: its name, how many heard you (for example "2 of 3 listening"), a bar with who heard you on the scale of the skimmers listening, with the circle of the theory, and the line "Theory 1.1, you 2";
- the surprises, for example "1 surprise: it heard you where the theory gave less than 5%", with a chip for each skimmer: tap it to highlight its arc on the globe;
- the note for your station ("For your station (…) the theory gave … skimmers."), only where that forecast is verified;
- the Ionosphere card with the MUF of the ionosonde ("MUF at Roma", forecast and measured, "Higher than forecast" or "Lower than forecast"), only where Today's sky is shown;
- How it is worked out: open it to read the method. The margin is worked out only with at least 3 skimmers expected. With a directional antenna a note explains that the forecast for your station imagines it pointed at each skimmer. If today's sky is missing, the note says why: no nearby ionosonde with a recent measure, VOACAP did not answer, or an ionosphere weaker than the model can represent.
Skimmers
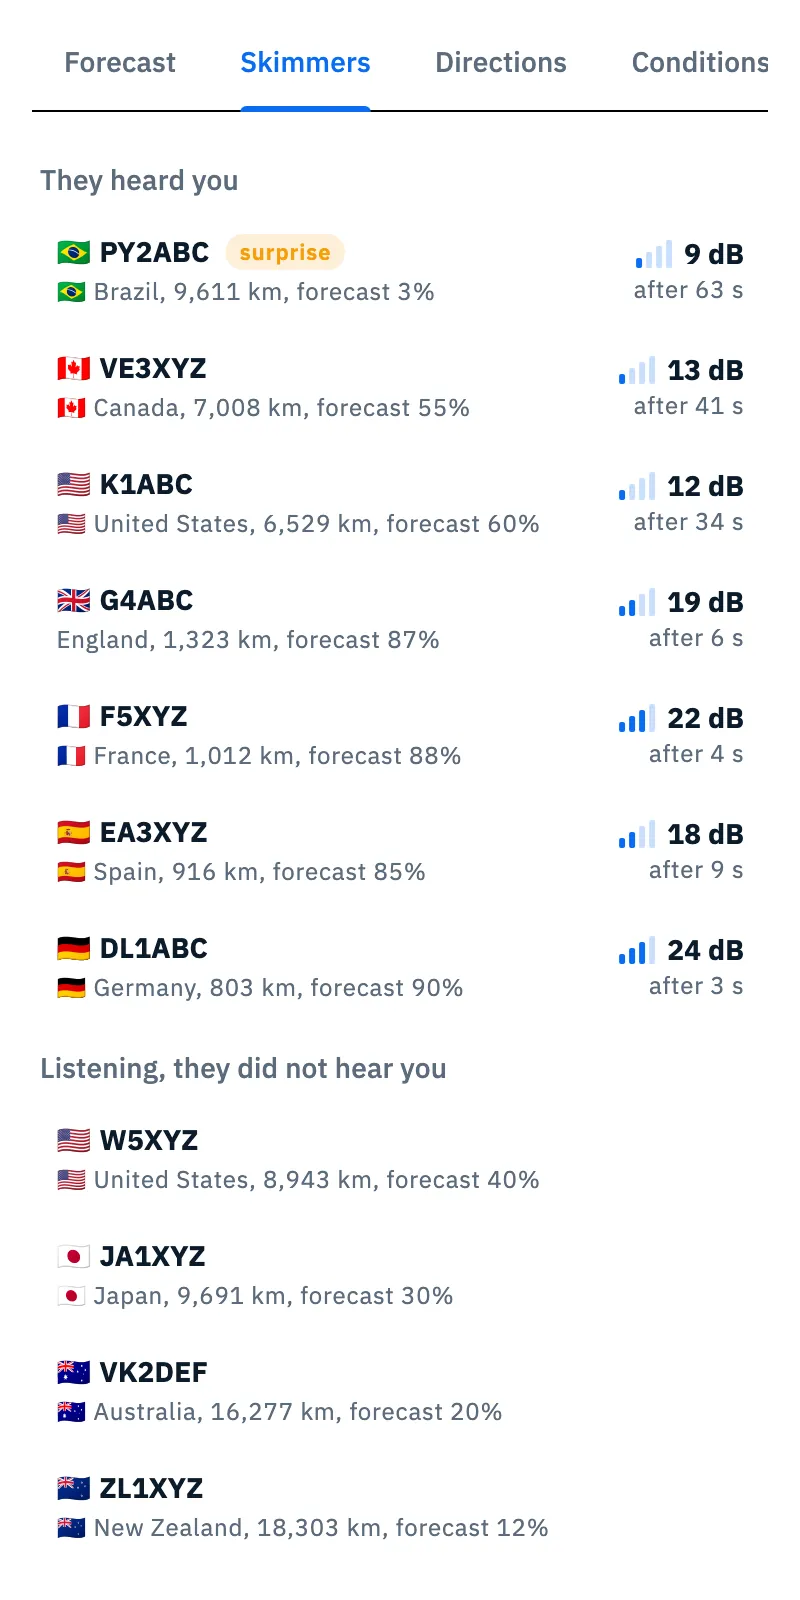
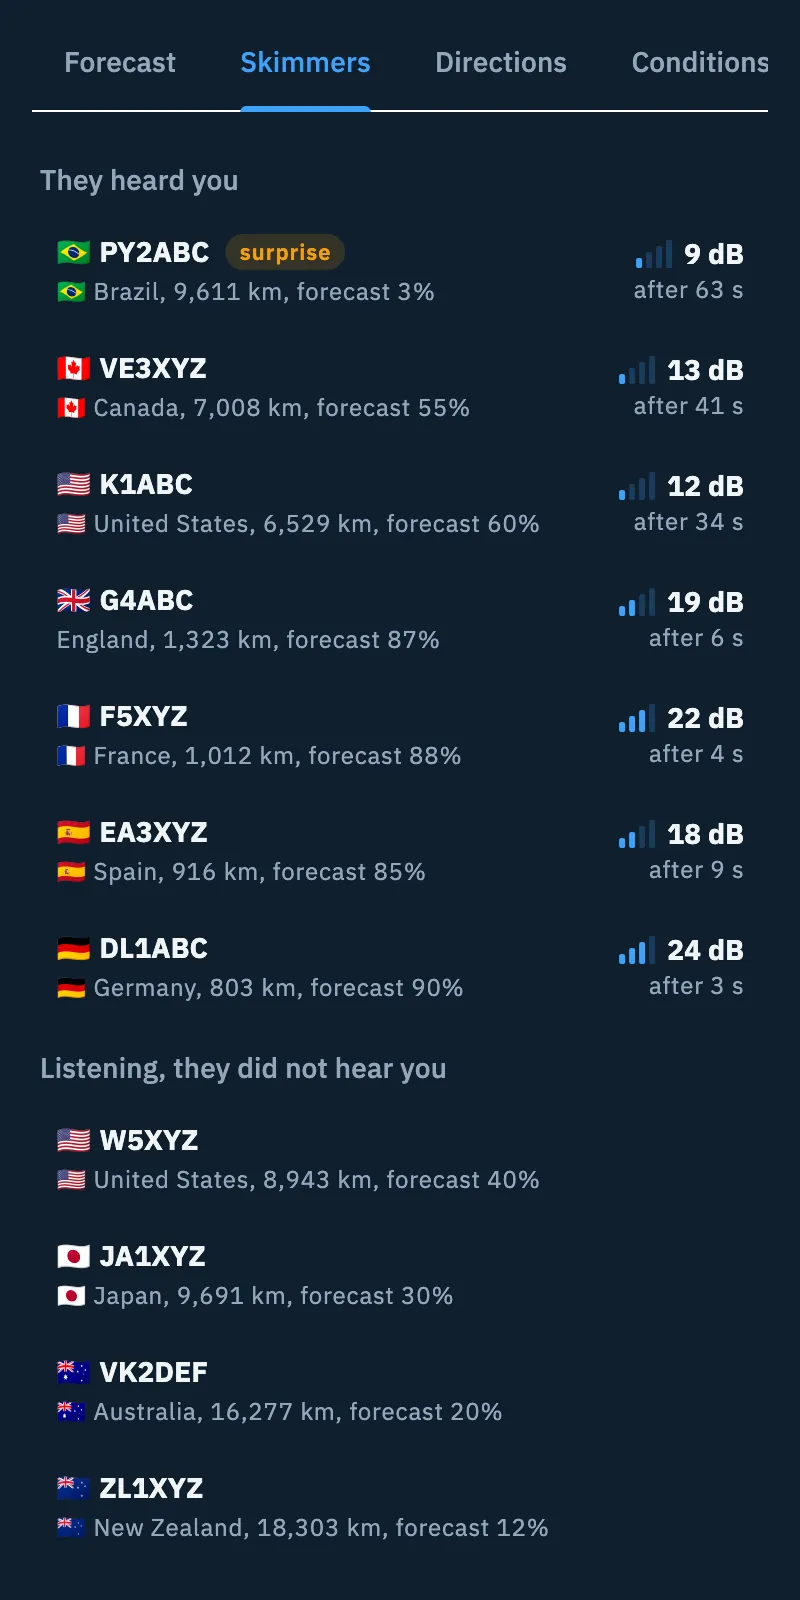
It lists all the skimmers of the test in two groups: They heard you, farthest first, and Listening, they did not hear you, most likely first according to the forecast. Each row shows flag and callsign, country and distance, the forecast probability (for example "forecast 60%", only where the forecast is shown), the surprise tag when it applies and, for those that heard you, the signal in dB with the bars and "after 34 s".
Tap a row to highlight its arc on the globe; tap it again to remove the highlight.
Directions
A compass rose in 16 sectors shows in which directions you got through: solid is who heard you, dashed the forecast ("Dashed is the forecast, solid who heard you.", only where the forecast is shown). It helps you see where your antenna radiates.
Conditions
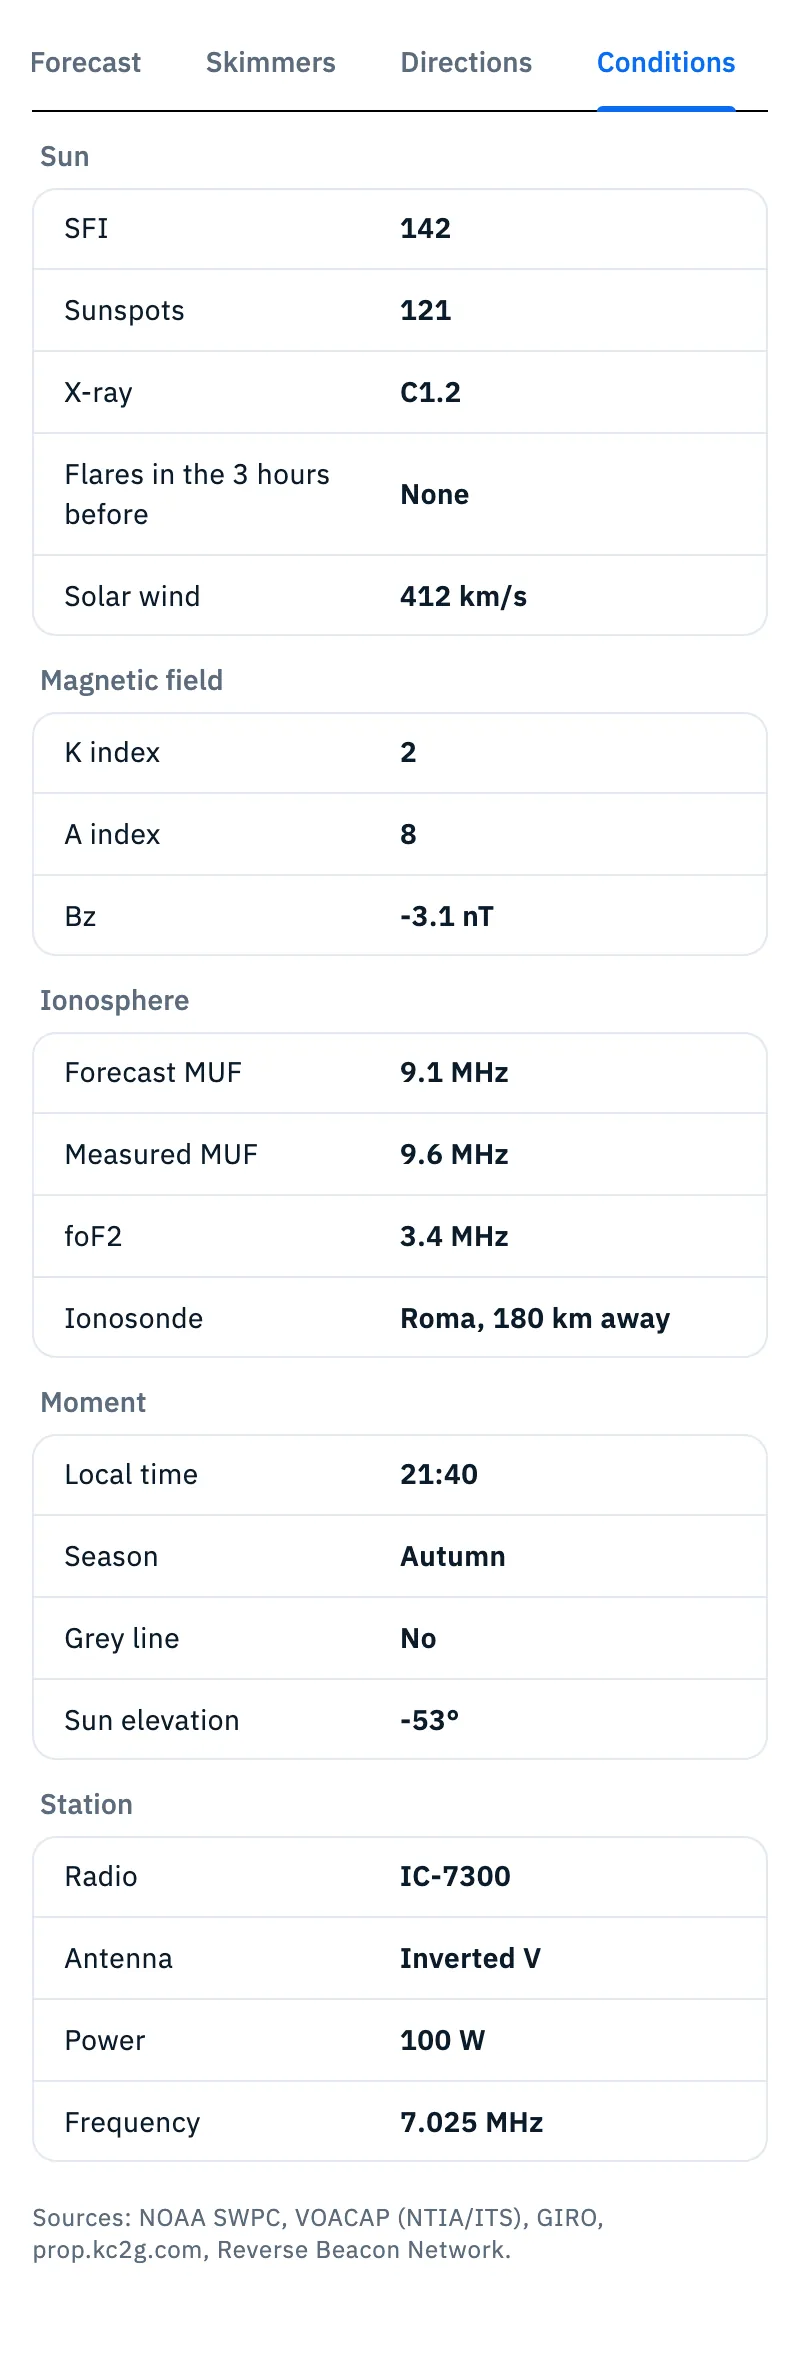
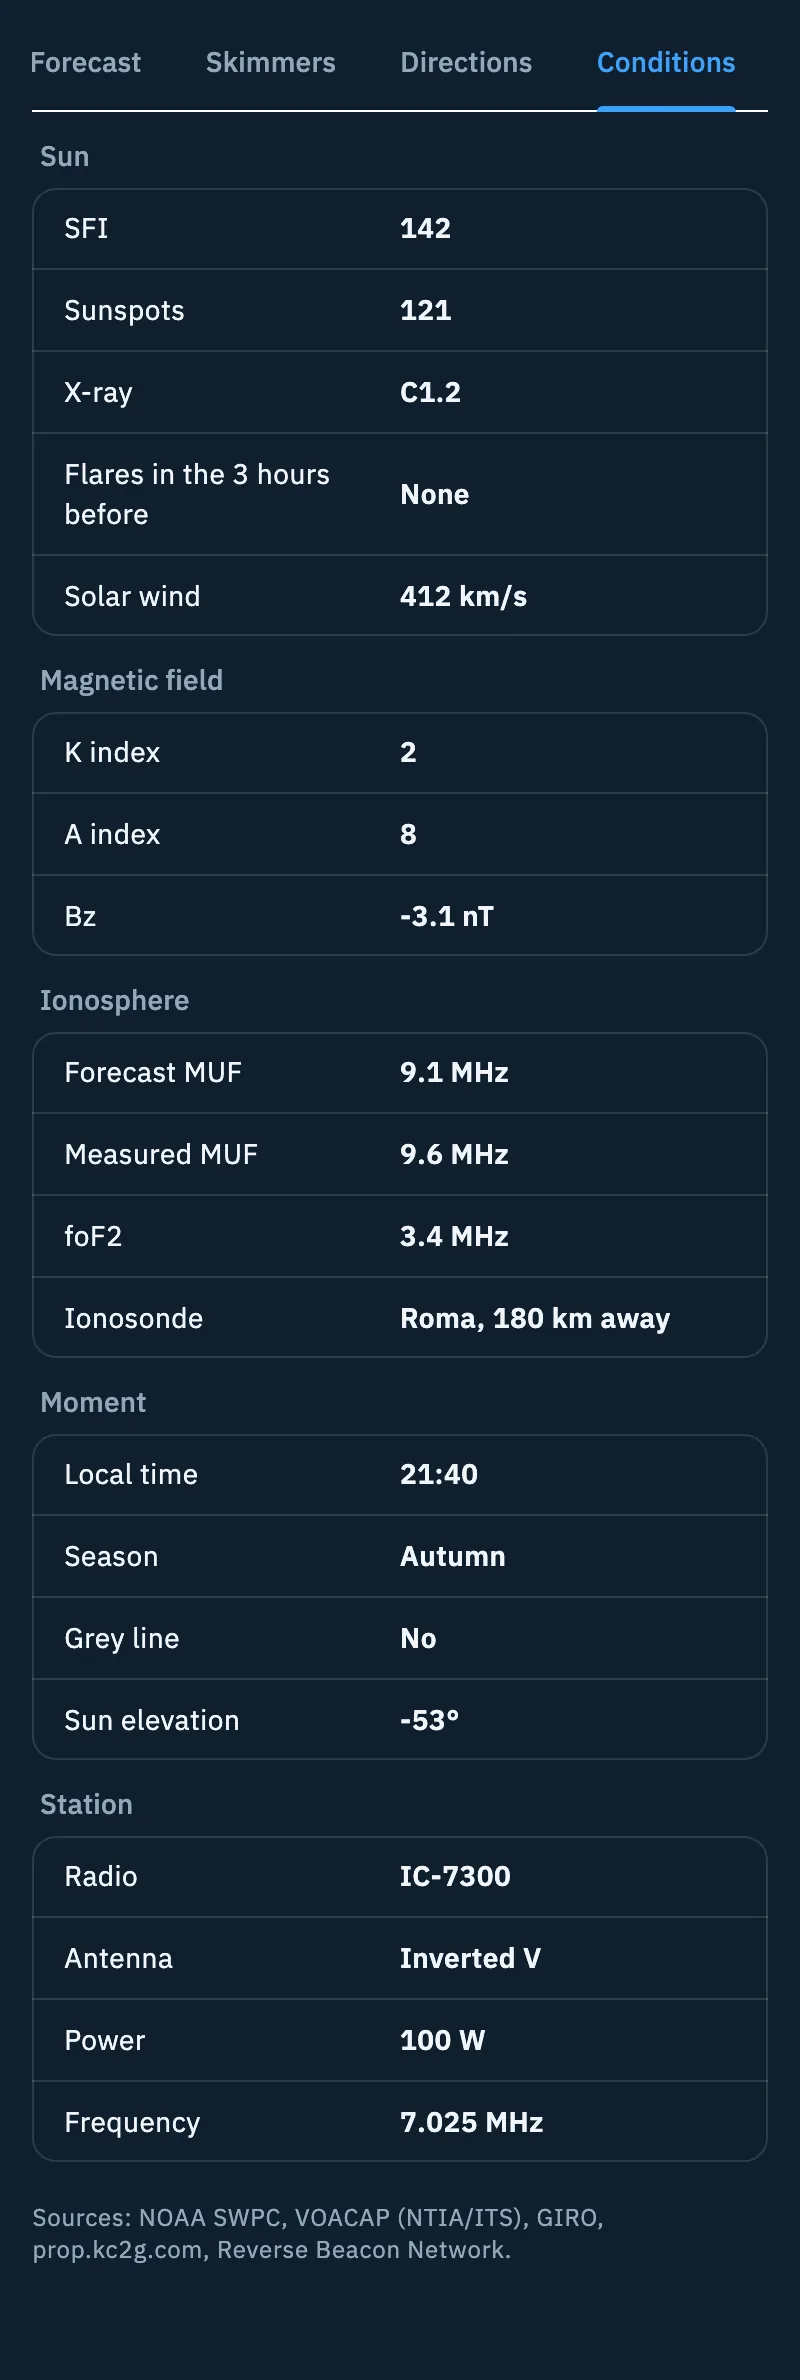
It collects the sky at the time of the test, saved with the test, so you can see why one day went better than another:
| Group | Values |
|---|---|
| Sun | SFI, Sunspots, X-ray, Flares in the 3 hours before ("None" if there were none), Solar wind in km/s |
| Magnetic field | K index, A index, Bz in nT |
| Ionosphere | Forecast MUF (only where the forecast is shown), Measured MUF, foF2, Ionosonde with name and distance |
| Moment | Local time, Season, Grey line (Yes or No), Sun elevation in degrees |
| Station | Radio, Antenna, Power, Frequency |
At the bottom is the "Sources: …" line with the sources used for that test: NOAA SWPC, VOACAP (NTIA/ITS), the ionosonde network (GIRO or INGV eSWua) and prop.kc2g.com when they were used, Reverse Beacon Network. A missing value shows as "—", never as zero. Distances follow the units chosen in the app (see Language, theme and units).
Phone, tablet and computer
- Phone (and a narrow window): everything in one column, the globe at the top and the tabs below.
- Tablet, computer and web in a wide window: the globe on the left with the big number and the levels on it, the panel with sources, actions and tabs on the right.
Troubleshooting
"No skimmer heard you" The app suggests "Try another band, more power or another time of day. CW goes far: when the band is open a few watts are enough." Tap Check propagation to see how the bands are doing now (see Reading propagation) or Try another band. The big number becomes "0 skimmers", with the line that says how many skimmers were listening and "It is saved for comparison, but not offered for sharing."
"The forecast is not available now" The test is valid. Save it: the app asks for the forecast again when you open My coverage or that test, for 24 hours after the end of the test. A result you do not save stays without the forecast. If it has not arrived after 24 hours, the test stays without the forecast.
I don't see the Forecast tab nor "Theory" You are on a band where the forecast is not verified (today it is shown only on 40 m and 30 m), or the forecast of this test has not arrived yet: see above.
I stopped the transmission and there is no result If you tap Stop while the radio is transmitting and nobody has heard you yet, you read "Transmission stopped": the test is not saved. Start again when you like.